Figure 5.

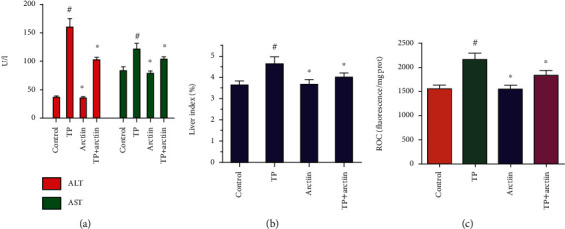
Effects of TP, arctiin, or combination on (a) AST and ALT levels, (b) liver index, and (c) ROS levels. Data were presented as means ± SD (n = 10). #P < 0.05 compared with the control group, ∗P < 0.05 compared with the TP group.

Effects of TP, arctiin, or combination on (a) AST and ALT levels, (b) liver index, and (c) ROS levels. Data were presented as means ± SD (n = 10). #P < 0.05 compared with the control group, ∗P < 0.05 compared with the TP group.