
Figure 6.
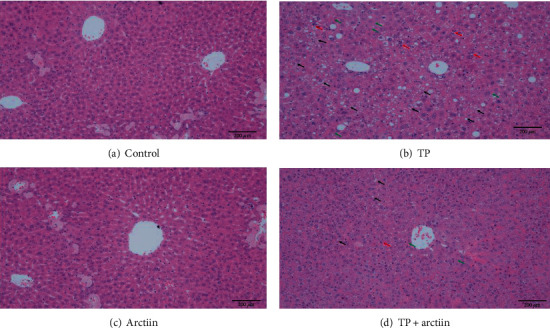
Effects of TP, arctiin, and TP + arctiin on the photomicrographs of hematoxylin and eosin-stained liver sections. Representative photomicrographs of H&E staining for liver sections from each group, respectively (bar = 200 μm): (a) control group, (b) TP group, (c) arctiin group, and (d) TP+ arctiin group.