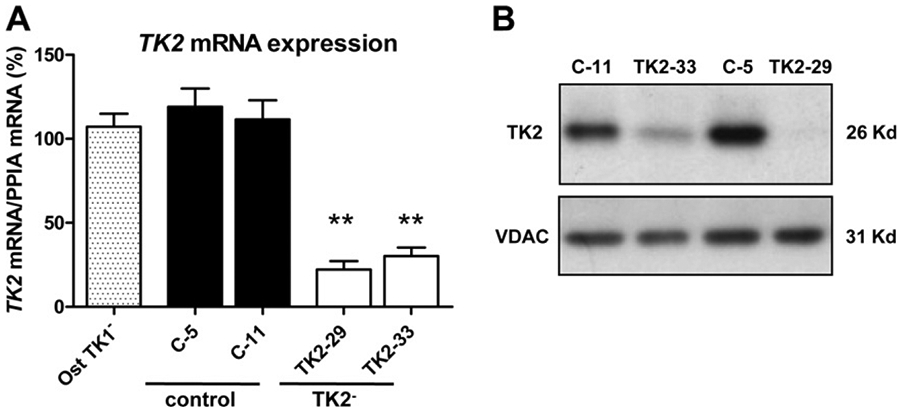
Fig. 1.

Analysis of TK2 expression in TK2-interfered Ost TK1− cells using quantitative real-time PCR and immunoblotting. (A) TK2 relative mRNA expression in Ost TK1− parental cell line (Ost TK1−), 2 control cell lines (C-5, C-11) and 2 TK2-interfered cell lines (TK2-29, TK2-33). Bars are means ± SEM of 4–5 independent cultures and are expressed as percentage values. **P < 0.001. (B) Representative Western blot showing the reduction of TK2 protein in TK2-deficient clones. VDAC immunoblot signal showing similar mitochondrial protein load.
