Fig. 3.

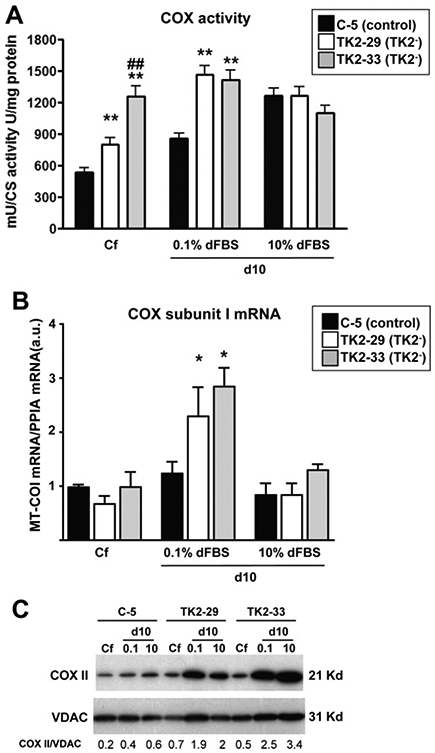
Activity and expression of cytochrome c oxidase components in TK2-interfered cells. (A) cytochrome c oxidase (COX) activity in control and TK2-deficient cells at confluence (Cf) and 10 days post-confluence in 0.1% and 10% dFBS. Data are expressed as milliunits of COX activity per units of citrate synthase (CS) activity per milligram of total protein. (B) cytochrome c oxidase subunit I mRNA levels in control and TK2-deficient cells at distinct culture conditions. Data are expressed as arbitrary units. Bars are means ± SEM from 5 to 6 independent cultures. *P < 0.05, **P < 0.001; TK2− versus control; ##P < 0.001; TK2-29 versus TK2-33. (C) Representative immunoblot of COXII protein content in TK2-deficient and control cells. VDAC indicates mitochondrial protein leading control, and numbers indicate COII/VDAC ratios after densitometric quantification.
