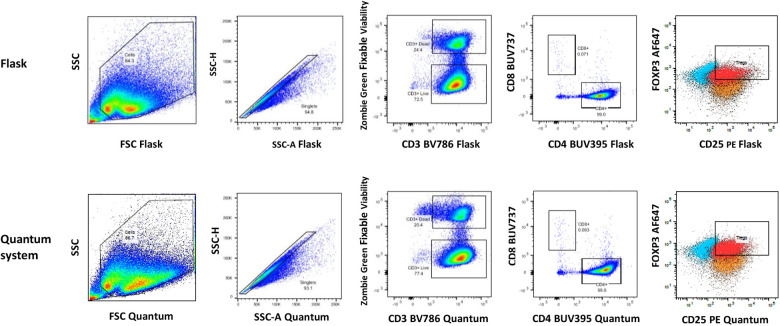
Figure 4.
Example of flow cytometry gating strategy for phenotyping of Tregs in both flask and Quantum system Treg-harvested cells. Treg frequency is based on the number of CD4+CD25+FoxP3+ cells within the CD25+FoxP3+ double-positive gate that are above background FMO fluorescence for both FoxP3 and CD25. Flask gate labels, plots left to right: SSC vs FSC cells, singlets (SSC-H vs SSC-A), CD3+ dead and CD3+ live, CD8+ vs CD4+, CD25+FoxP3+ Tregs; Quantum system gate labels, plots left to right: SSC vs FSC cells, singlets (SSC-H vs SSC-A), CD3+ dead and CD3+ live, CD8+ vs CD4+, CD25+FoxP3+ Tregs. FoxP3 AF: 647; CD8 BUV: 737; CD3 BV: 786; CD4: BUV395; FMO: fluorescence minus one; FoxP3: forkhead box protein P3; FSC: forward scatter; PE: CD25; SSC: side scatter; SSC-A: side scatter - area; SSC-H: side scatter - height; Tregs: regulatory T cells.

