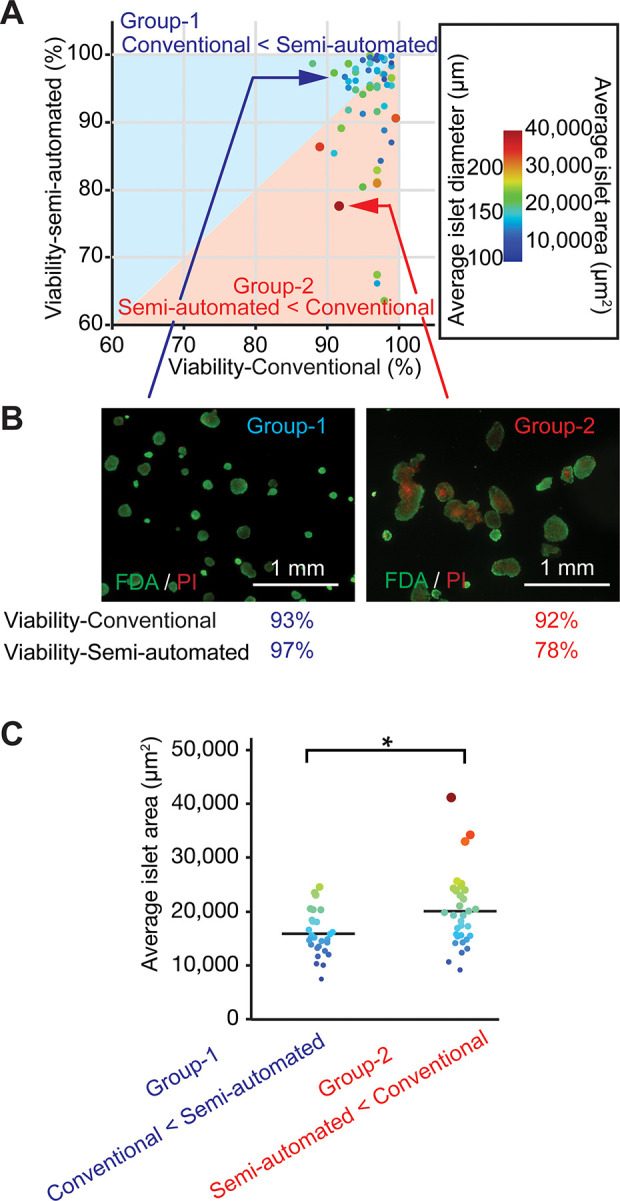
Fig. 4.

The semi-automated method allows islet-size-sensitive analysis with distinction between small and large islets and enables precise viability evaluation. (A) Islet batches are colored based on average islet size. Islet batches were also classified into two groups: Group 1 (upper left, hatched in blue, n = 28) demonstrating viability-conventional < viability-semi-automated and Group 2 (lower right, hatched in orange, n = 33) demonstrating viability-semi-automated < viability-conventional. Group 2 contained batches of large-sized islets. (B) Representative islet appearance in the two indicated groups, exemplifying the difference in islet size. (C) Average islet size analysis demonstrated a significant difference in islet area between the two groups. *P = 0.0071.
