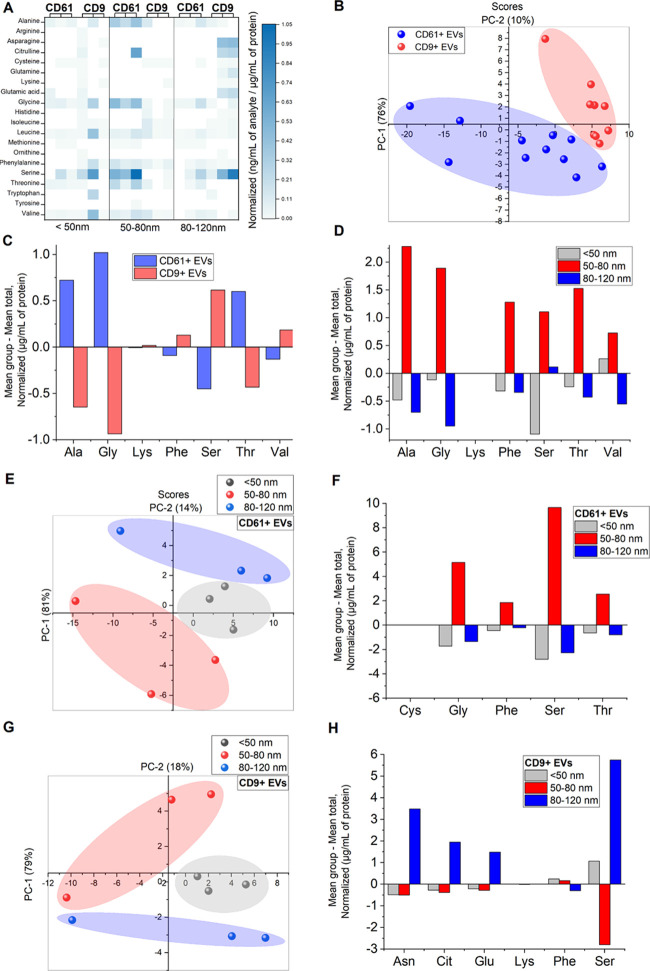
Figure 4.
Multivariate analysis of amino acids found in CD61+ and CD9+ EV subpopulations. Heat map visualization of amino acids corresponding to their normalized concentrations (ng/mL per μg/mL of total protein) (A). Scoring plot of PCA analysis showing differences between CD61+ and CD9+ EVs (B). Discriminant analysis of differences between amino acids found in CD61+ and CD9+ EVs (C). Discriminant analysis of differences between amino acids found between different sizes of combined EV subpopulations (D). Scoring plot of PCA analysis revealing differences between subpopulations of different sizes of CD61+ EVs (E). Discriminant analysis of differences between amino acids found between CD61+ EV subpopulations (F). Scoring plot of PCA analysis revealing differences between subpopulations of different sizes of CD9+ EVs (G). Discriminant analysis of differences between amino acids found between CD9+ EV subpopulations (H).

