Figure 4.

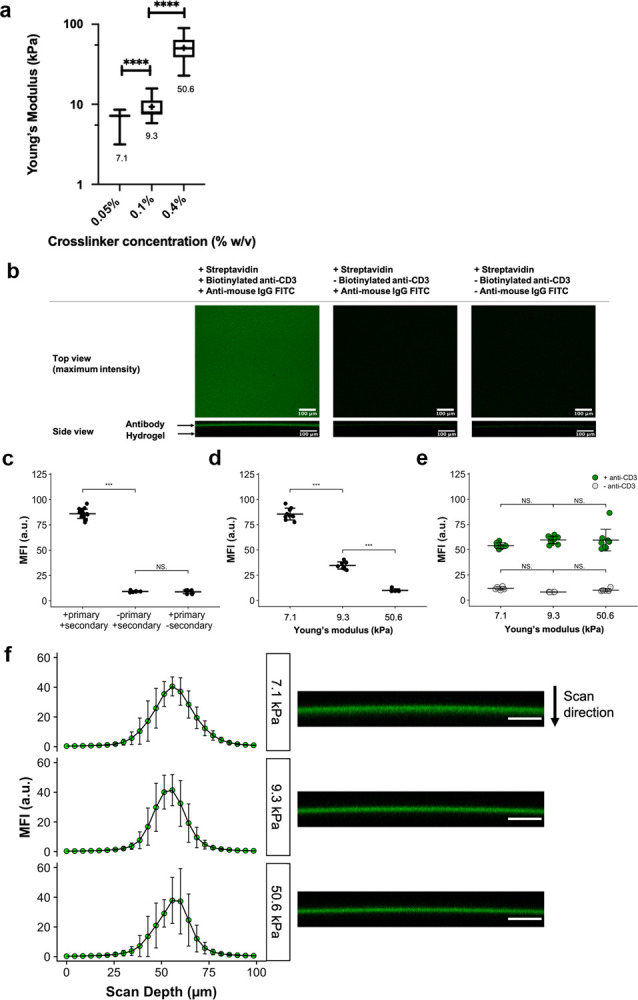
(a) Young’s modulus of hydrogels measured via AFM-based indentation. Box-and-whisker plots: whiskers = min-max, line = median, box = 25–75%, cross (+) = mean. **** denotes p ≤ 0.0001. Welch’s ANOVA with Games–Howell post-hoc test (α = 0.05) was used. (b) Conjugation of anti-CD3 to PA hydrogels via biotin-streptavidin capture. Top row (x–y projection): representative confocal microscopy images (top-down view) of streptavidin-doped PA hydrogels coated with biotinylated anti-CD3 and detected using FITC-conjugated anti-mouse IgG, which appears as green in the left image. Negative controls (middle and right images) showed minimal binding of the secondary antibody to the hydrogel when anti-CD3 was absent. All gels depicted here correspond to those of 7.1 kPa. Bottom row (x–z projection): representative side projections of hydrogels. The green layer visible in the left image represents the antibody layer. All scale bars are 100 μm. (c) Mean fluorescence intensities (MFIs) of hydrogels (7.1 kPa) incubated with (+) primary and secondary antibodies compared with MFIs of those without (−) either the primary or secondary. (d) Pre-normalization of surface ligand density: significant reduction in MFI was observed with increasing stiffness when the same concentration (100 μg/mL) of streptavidin-conjugated acrylamide was used. (e) Post-normalization of surface ligand density: no significant MFI differences were observed in anti-CD3-coated hydrogels. For (c–e), data = mean ± standard deviation. Data points represent individual MFI readings obtained from at least 3 separate hydrogels per condition and at least 2 ROIs per gel. *** denotes p ≤ 0.001; NS means no significance. One-way ANOVA with Tukey’s test (α = 0.05) was used. (f) Left column: z-axis profiles of mean fluorescence intensity (MFI) versus scan depth obtained by confocal microscopy for streptavidin-doped PA hydrogels coated with biotinylated anti-CD3. Data presented as mean values with standard deviation error bars. Data points represent individual MFI readings obtained from at least 3 separate hydrogels per stiffness and at least 2 ROIs per gel. Right column: representative x–z projection images of respective hydrogels. Scale bar = 100 μm.
