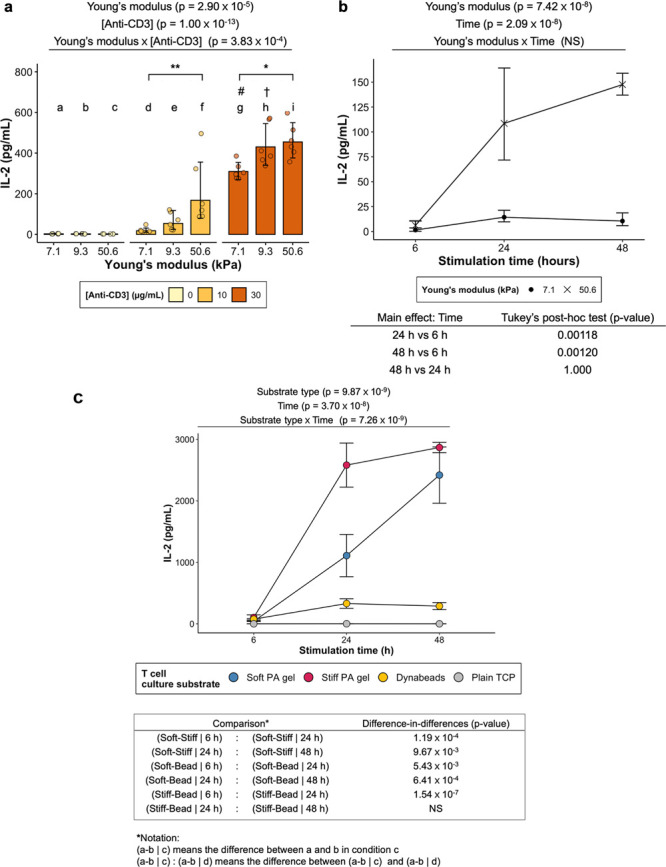
Figure 5.

(a,b) Stimulation of Jurkat cells using anti-CD3-coated PA hydrogels. P-values returned by two-way ANOVA are noted above the plots. (a) IL-2 secretion from the cells stimulated on Ab-coated hydrogels of different formulations. P-values of main effects (Young’s modulus and [Anti-CD3]) and interaction effect (Young’s modulus × [Anti-CD3]) returned by ANOVA are noted above the plot. Data presented as geometric means with 95% confidence interval error bars back-transformed from the log10 scale to the original scale. Points represent individual data points from three independent experiments (N = 3). Two-way ANOVA (with interaction; White-adjusted for heteroscedasticity) on log10-transformed data followed by Games–Howell post-hoc test (α = 0.05). # Significant difference (p < 0.0001) from d. † Significant difference (p < 0.01) from e. * p < 0.05. ** p < 0.01. (b) The effect of stimulation time on IL-2 secretion from Jurkat cells stimulated by 7.1 (soft) and 50.6 kPa (stiff) gels. Both stiff and soft gels were coated with 10 μg/mL anti-CD3. P-values returned by two-way ANOVA are noted above the plots. Data presented as geometric means with 95% confidence interval error bars back-transformed from log10 the scale. N = 3. Two-way ANOVA on log10-transformed data followed by Tukey’s post-hoc test on the main effect of stimulation time (α = 0.05). P-values from pairwise comparisons are shown below the plot. (c) IL-2 secretion by Jurkat cells stimulated by soft gels (7.1 kPa) and stiff gels (50.6 kPa) presenting both signals 1 (anti-CD3) and 2 (anti-CD28). Dynabeads presenting the same signals were included as a positive control. TCP devoid of any stimulatory signals was employed as a negative control. ART two-way ANOVA (with interaction) followed by post-hoc interaction contrast (difference-in-differences) analysis (α = 0.05). P-values for main effect (substrate type and time) and interaction (substrate type × time) effects returned by ANOVA are noted above the plot. Substrate type refers to the substrate material employed to stimulate Jurkat cells. Data presented as mean ± standard deviation. N = 3. Post-hoc comparisons between groups stimulated by soft gels, stiff gels, and Dynabeads are shown in the table below the plot, where the p-values indicate whether there is a significant difference in the differential response between a pair of substrate types for a particular stimulation time relative to that of another pair for another stimulation time. NS means not significant.
