Figure 6.
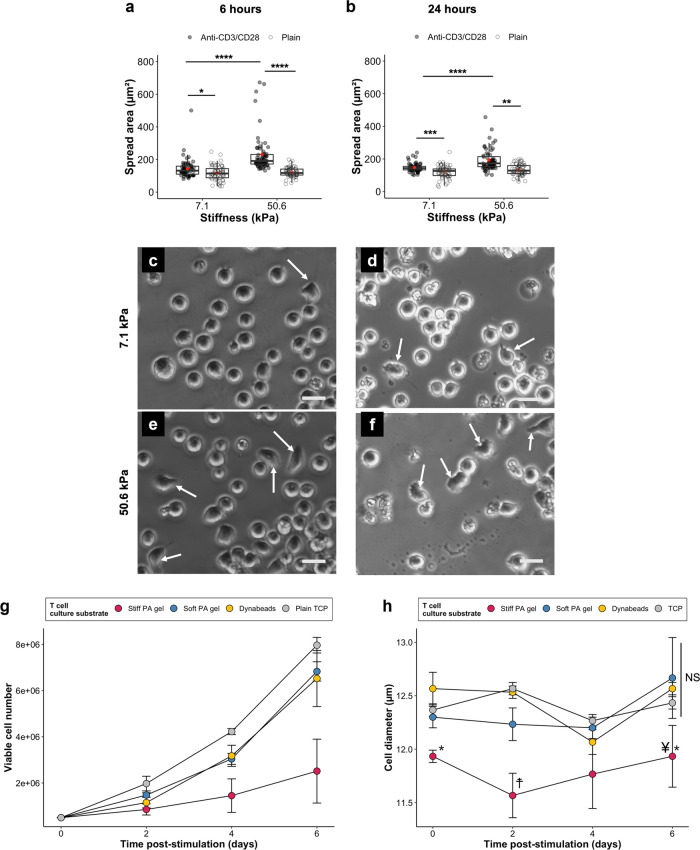
Spread areas of Jurkat cells after (a) 6 and (b) 24 h of stimulation on anti-CD3/CD28-coated and plain gels (7.1 vs 50.6 kPa). Measurements taken from 3 gels per condition (total ≥60 cells). Red dots represent averages. Individual data points and box-and-whisker plots are shown. *p < 0.05; **p < 0.01; ***p < 0.001; ****p < 0.0001, two-sample Kolmogorov–Smirnov test (α = 0.05). Representative phase contrast microscopy images of cells on anti-CD3/CD28-coated (c,d) 7.1 and (e,f) 50.6 kPa gels. Arrows indicate cells with a flattened or elongated morphology. Scale bars = 20 μm. (g) Post-stimulation proliferation of Jurkat cells. Data = mean ± standard deviation. N = 3. (h) Cell diameters of Jurkat cells in post-stimulation proliferation time course. Data presented as mean ± standard deviation. N = 3. Two-way ANOVA with Tukey’s test (α = 0.05). * Significant difference (p < 0.01) from Dynabeads (same time). † Significant difference (p < 0.01) from all (same time). ¥ Significant difference (p < 0.001) soft PA gel (same time). NS Not significant (same time).

