
Figure 3.
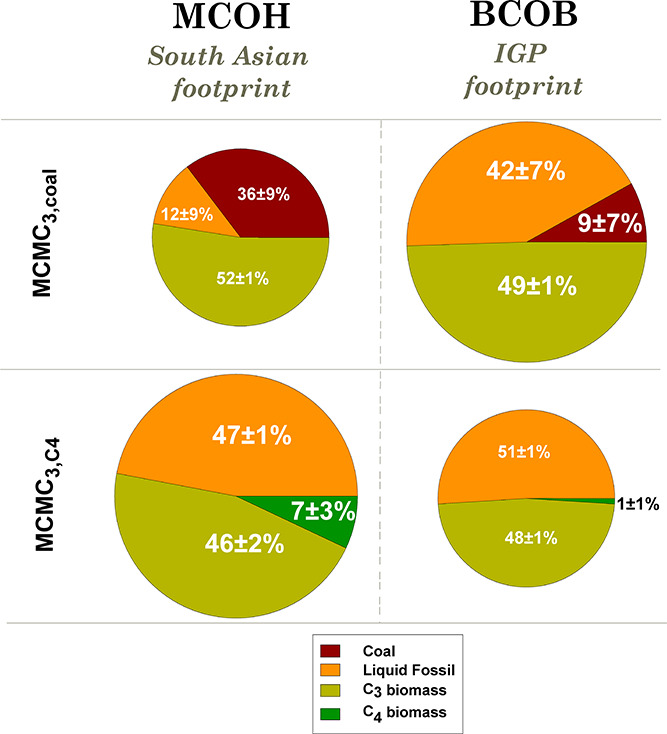
BC source fractions during SAPOEX-16 were computed using MCMC simulations (Mean ± SD) of fossil coal combustion (brown), liquid fossil fuel combustion (orange), and biomass burning C3-plants (light green) and C4-plants (dark green). Results from two three-source modeling scenarios (MCMC3,coal: C3 biomass, coal, and liquid fossil fuel and MCMC3,C4: C3 biomass, C4 biomass, and liquid fossil fuel) are shown (see also Supporting Information Figures S5 and S6). The bigger pie-charts represent the most likely statistical modeling scenario for observed BC isotopic footprints for the IGP (at BCOB; MCMC3,coal) and for the wider South Asia (at MCOH; MCMC3,C4)