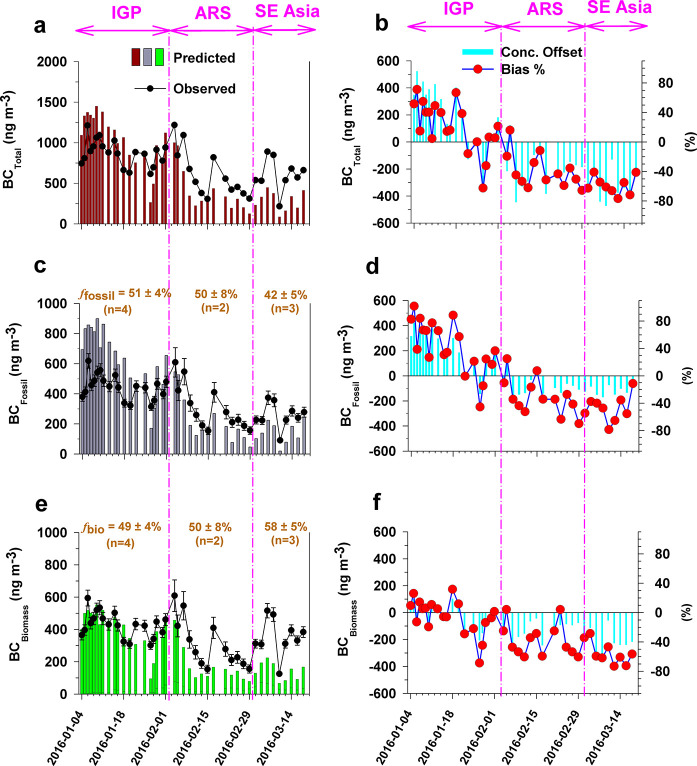
Figure 4.
Panels (a), (c), and (e), respectively, show total BC concentrations, fossil, and biomass BC concentrations for observations (circles) and FEG model simulations (bars), at MCOH, respectively. Panels (b), (d), and (f) depict the concentration offsets (bars) and bias (red circles) from the corresponding model-observation comparisons. The different source regions (IGP, ARS, and SE Asia) influencing sampling at MCOH during SAPOEX-16 are identified using air mass back trajectory analysis (Supporting Information Figures S2 and S3; see also Supporting Information Note S7), and source concentrations are deconvoluted based on combination of total BC concentrations with average Δ14C-fbio in different air mass regimes (Supporting Information Table S4).

