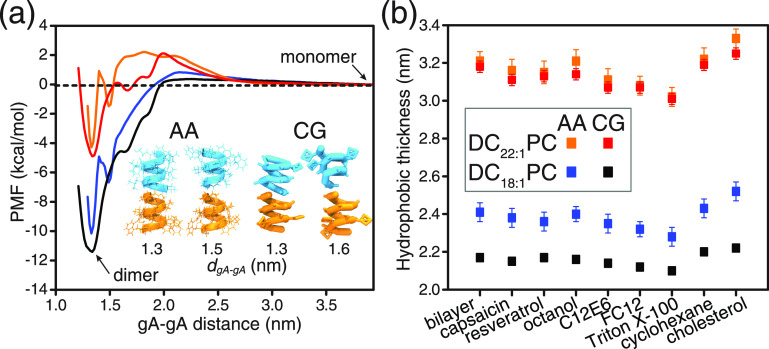
Figure 2.
(a) PMF profiles for gA monomer ↔ dimer transition in the DC18:1PC and DC22:1PC bilayers (orange: AA-DC22:1PC; red: CG-DC22:1PC; blue: AA-DC18:1PC; black: CG-DC18:1PC). The reaction coordinate is the center-of-mass distance between the two gA monomers. In the AA simulations, the center-of-mass of the gA monomer is defined using all Cα atoms of the monomer; in the CG simulations, the center of mass of the monomer is defined using all backbone beads of the monomer. In the AA-REUS simulations, two structurally different dimers are obtained at gA–gA distances of ∼1.3 and ∼1.5 nm. At dgA–gA ≈ 1.3 nm, the two subunits can form a maximum number of six hydrogen bonds, while at dgA–gA ≈ 1.5 nm, the two subunits can only form a maximum number of four hydrogen bonds due to the relative rotation between the two monomers. The two different gA dimer structures are also observed in the CG-REUS simulations, and the derived CG PMF profiles exhibit a free energy minimum at dgA–gA = 1.3 nm and a kink at dgA–gA = 1.6 nm. (b) Effects of the tested drugs on the hydrophobic thickness of DC18:1PC and DC22:1PC bilayers. The methods used to calculate the bilayer’s hydrophobic thickness are illustrated in Figure S1. For the DC18:1PC bilayer, the calculated hydrophobic thickness values using the AA and the CG models deviate by ∼0.2 nm. This discrepancy can be attributed to the four-carbon mapping scheme of the CG building blocks, as illustrated in Figure S1. The error bars for AA and CG simulations are ±0.05 and ± 0.03 kcal/mol, respectively.

