Figure 5.

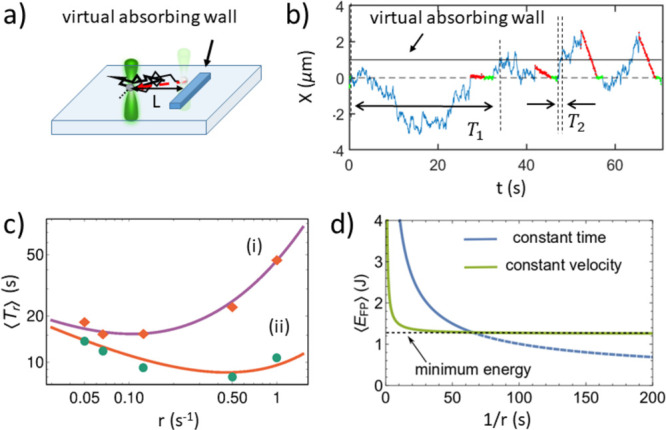
(a) Schematic illustration of a first-passage experiment. The target is a virtual absorbing wall. (b) Projection of the particle’s trajectory onto the x-axis. The position of the wall is marked as a solid line. Returns are marked in red (return time τ0 = 3.79 s), and waiting periods are marked in green. The first two first-passage times are marked by T1 and T2. (c) Mean FPT to the wall vs the resetting rate for (i) noninstantaneous returns with τ0 = 3.79 s and (ii) instantaneous returns (τ0 = 0). Theoretical predictions (eq 6, solid lines) are in good agreement with experimental data (symbols). (d) Energy cost per first-passage event for the constant time (blue, τ0 = 3.79 s) and constant velocity (green, v = 0.8 μm/s) return protocols. For a fixed laser power, the energetic cost of the constant velocity protocol is bounded from below. In the constant time protocol, we have dashed the range of resetting rates where the average return velocity is greater than v.46 The latter cannot exceed vmax, thus bounding the energy cost of the constant time protocol.
