Figure 1.

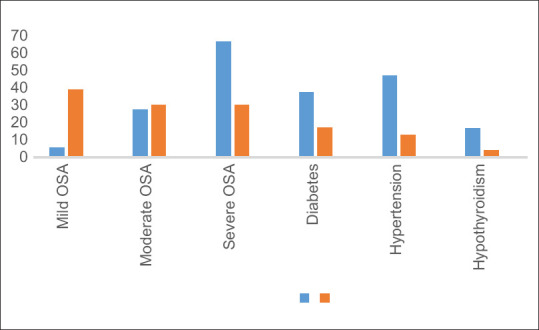
Difference in severity of OSA and comorbidities between obese and nonobese OSA. Number on the Y-axis represent proportion

Difference in severity of OSA and comorbidities between obese and nonobese OSA. Number on the Y-axis represent proportion