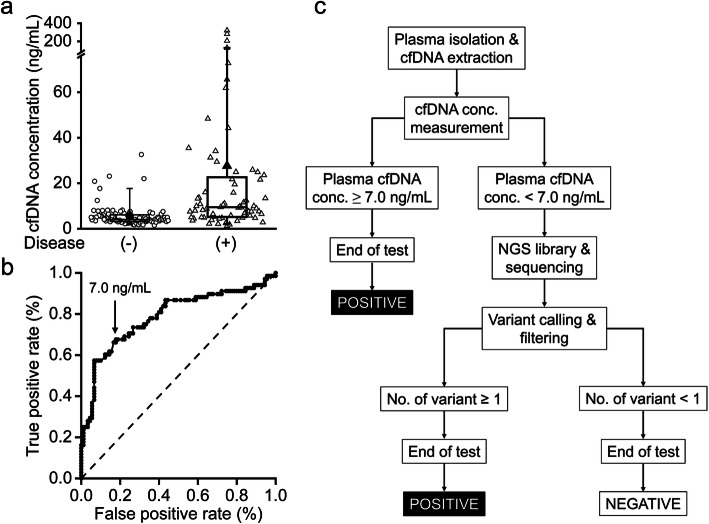
Fig. 1.
Proposed workflow of cfDNA analysis for treatment monitoring of CRC patients. a Boxplot displaying the cfDNA levels in plasma collected from patients in the disease negative (open circle; n = 90) and disease positive (open triangle; n = 68) groups at three different time points. The horizontal box boundaries and midline represent the sample quartiles, while the solid circle and triangle indicate the mean of the cfDNA concentrations. The upper and lower whisker denotes the 95th and 5th percentiles, respectively. b The receiver operating characteristics (ROC) curve of cfDNA concentration in determining the presence or absence of disease. The points in the ROC curve indicate different cfDNA concentrations with corresponding true and false positive rates, from which 7.0 ng/mL was chosen as the cut-off value for cfDNA concentration. The dotted line is the line of no-discrimination. c The cfDNA concentrations and sequencing results were integrated together in the analytical workflow. For patients with cfDNA concentration ≥ 7.0 ng/mL, the cfDNA test was defined as positive, and for patients with cfDNA concentration < 7.0 ng/mL, the detection of at least one cfDNA variant was required to define a positive cfDNA test

