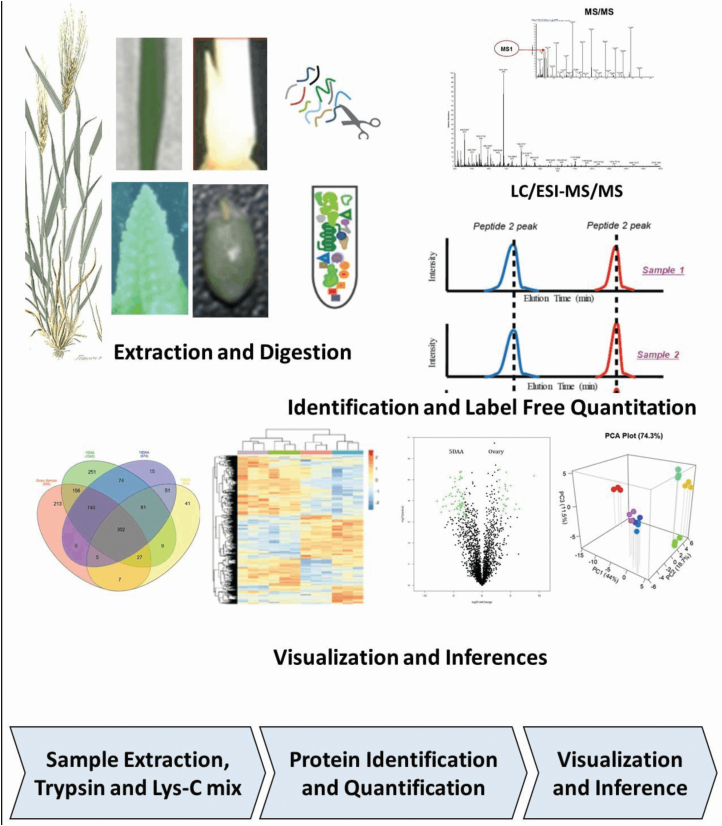
Figure 3.
Proteomic workflow: tissues were flash-frozen in liquid nitrogen. Proteins were extracted and digested into fragments using a combined action of trypsin and Lys-C mix. The protein fragments were separated using liquid chromatography (LC) and then quantified by mass spectrometry (MS). The MS/MS spectra were searched against the IWGSC v1.0 genome assembly of wheat (Triticum aestivum) recently published by Apples et al. (2018). Finally, label-free quantitation values were used in log2 scale for t-test comparisons.

