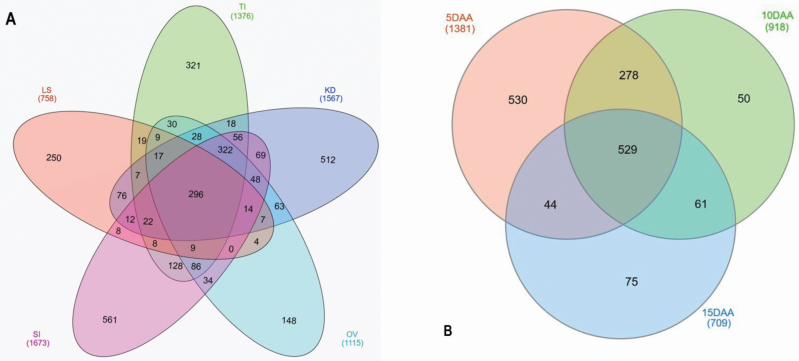
Figure 5.
Venn diagrams showing the distribution of common and uniquely abundant proteins across samples. (A) Protein distribution in five groups with kernel development stages combined and (B) proteins only across the three kernel development stages. LB = leaf sample; SI = spike initiation; TI = tiller initiation; OV = ovary; 5 DAA = 5 days after anthesis; 10 DAA = 10 days after anthesis; and 15 DAA = 15 days after anthesis.

