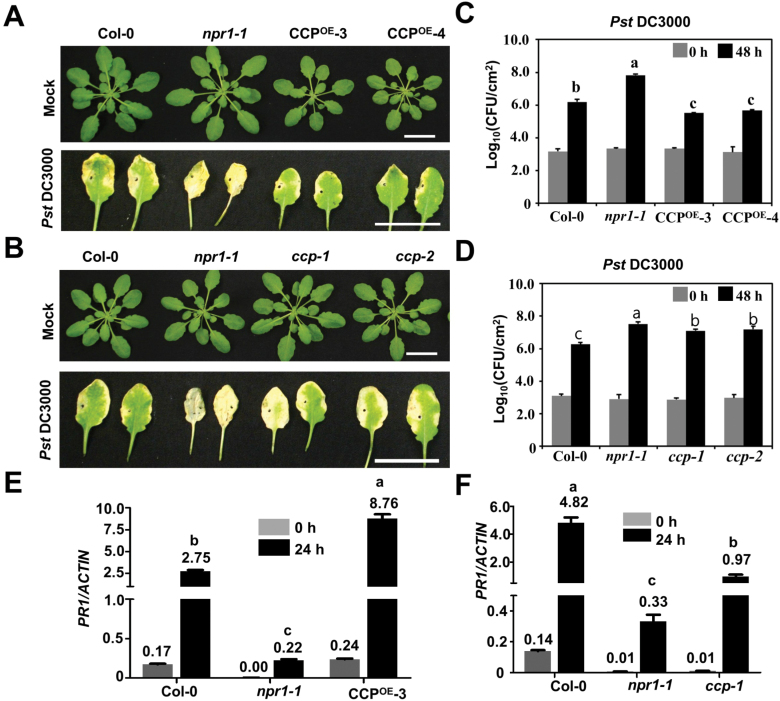
Fig. 4.
CCP improves plant resistance against bacterial pathogens. (A) Morphology and symptom development of wild-type Col-0, npr1-1, CCPOE-3-, and CCPOE-4 leaves inoculated with buffer or Pst DC3000 at 72 hpi. Scale bar=2 cm. (B) Morphology and symptom development of wild-type Col-0, npr1-1, ccp-1, and ccp-2 leaves inoculated with buffer or Pst DC3000 at 72 hpi. Scale bar=2 cm. (C) Growth of Pst DC3000 on infiltrated leaves of Col-0, npr1-1, CCPOE-3, and CCPOE-4 plants at 0 and 48 hpi. Four-week-old plants were infiltrated with Pst DC3000 (OD600=0.0002). CFU, colony-forming units. (D) Growth of Pst DC3000 on infiltrated leaves of Col-0, npr1-1, ccp-1, and ccp-2 plants at 0 and 48 hpi. (E and F) Relative ratio of the PR1 mRNA versus the endogenous actin mRNA in Col-0, npr1-1, CCPOE-3 (E), or ccp-1 (F) leaves infiltrated with Pst DC3000 (OD600=0.0002) at 0 and 24 hpi. In (C–F), scale bars represent means ±SE (n=3). Different letters indicate significant differences (P<0.05, n=3) determined by ANOVA by Turkey’s multiple comparison test analysis. (This figure is available in color at JXB online.)

