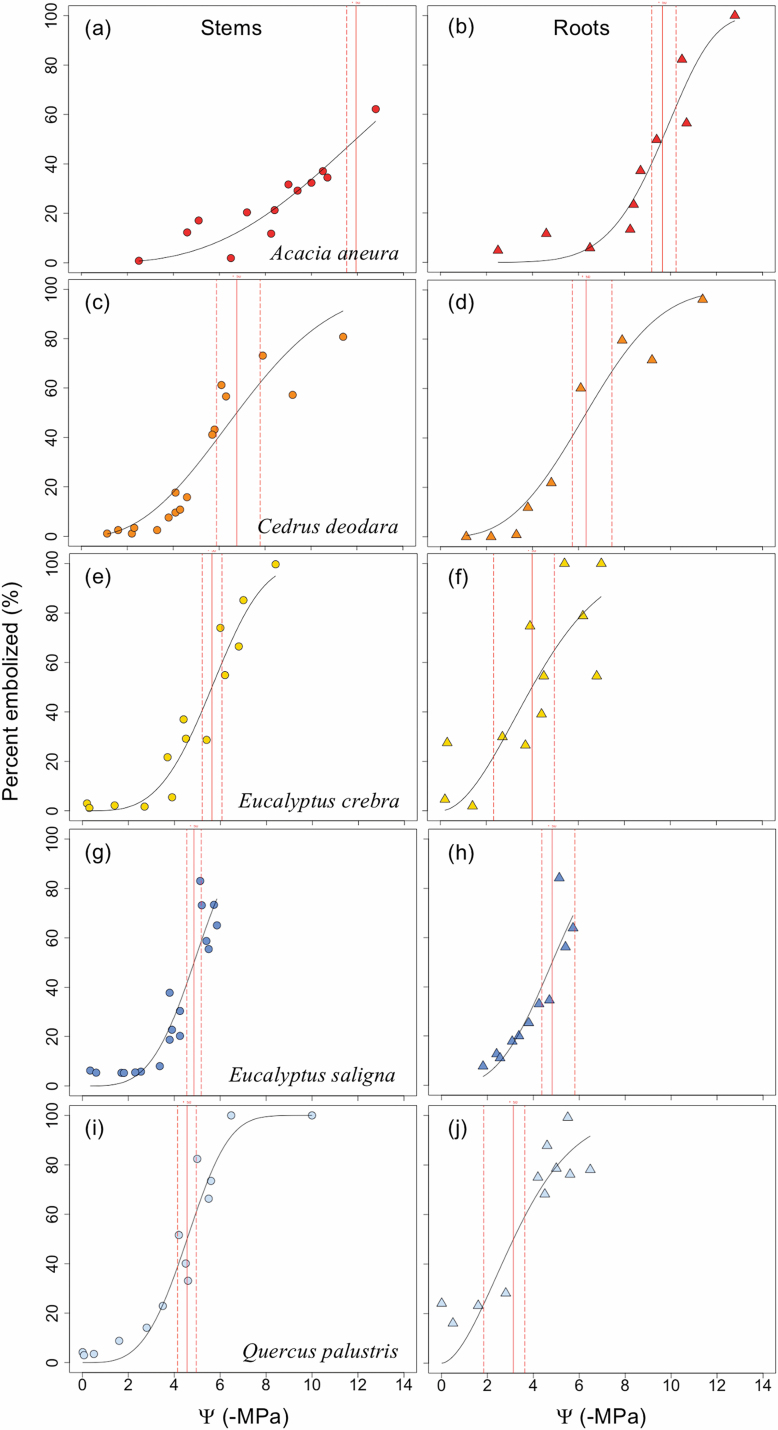
Fig. 2.
Xylem vulnerability to cavitation curves for stems (circles) and roots (triangles) of five species, Acacia aneura (A and B), Cedrus deodara (C and D), Eucalyptus crebra (E and F), Eucalyptus saligna (G and H), and Quercus palustris (I and J). Data are derived from counts of embolized conduits observed in microCT images during dehydration. The water potential at which 50% of conduits become embolized (P50) is indicated by a vertical red line, with dashed lines showing 95% confidence intervals. (This figure is available in colour at JXB online.)

