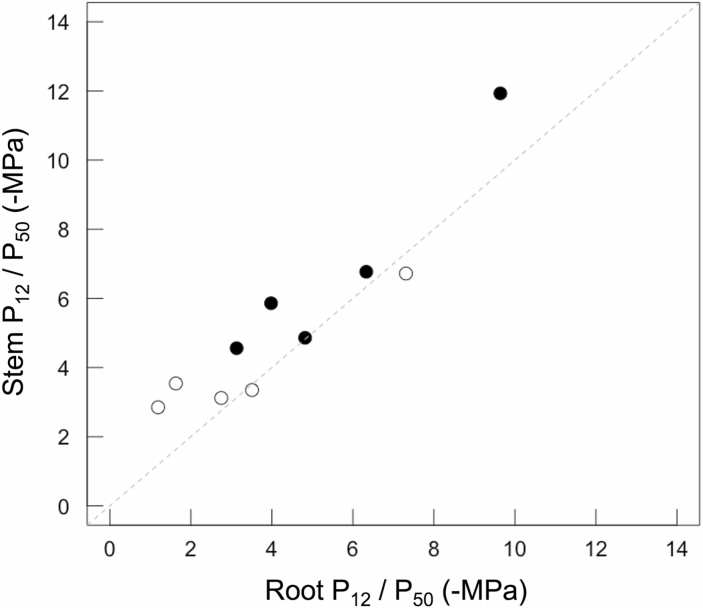
Fig. 3.
Scatterplot showing the relationship between estimates of P50 (filled symbols) and P12 (open symbols) for roots and stems of five woody species. Estimates of P50 and P12 were derived from vulnerability curves generated from microCT imaging of dehydrating, intact plants. Across species, P50 values of roots and stems were significantly related (regression slope=1.17; r2=0.91; P=0.01). Values of P12 were also related in stems and roots (regression slope=0.65; r2=0.87; P=0.02). Lines were fit with a standardized major axis model and did not differ from the 1:1 relationship (dashed line) between vulnerability parameters.

