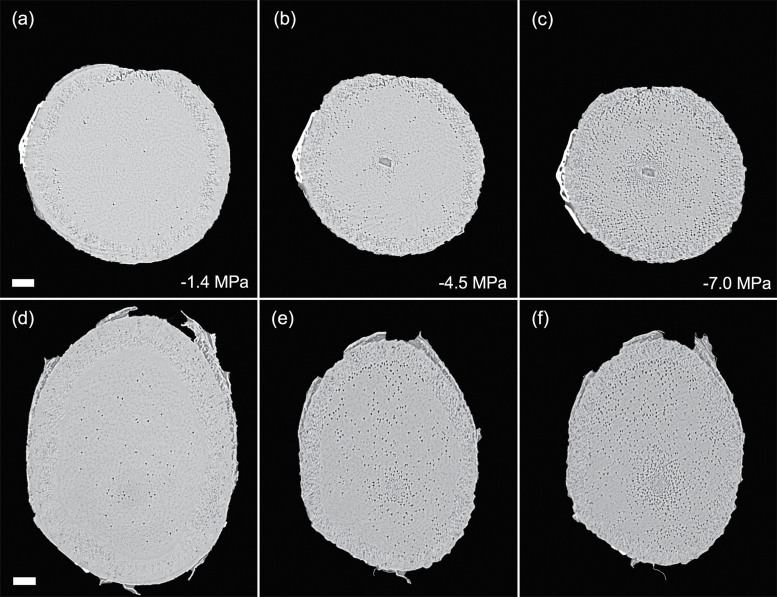
Fig. 6.
Transverse slices from microCT scans showing stems (A–C) and roots (D–F) of Eucalyptus crebra. Images are taken from a time series of scans on a single plant during dehydration treatment. The number of embolized vessels (black) increases with decreasing xylem water potential. Water potentials (MPa) are shown at the time of each scan. Scale bars are equal to 1000 μm in all panels.

