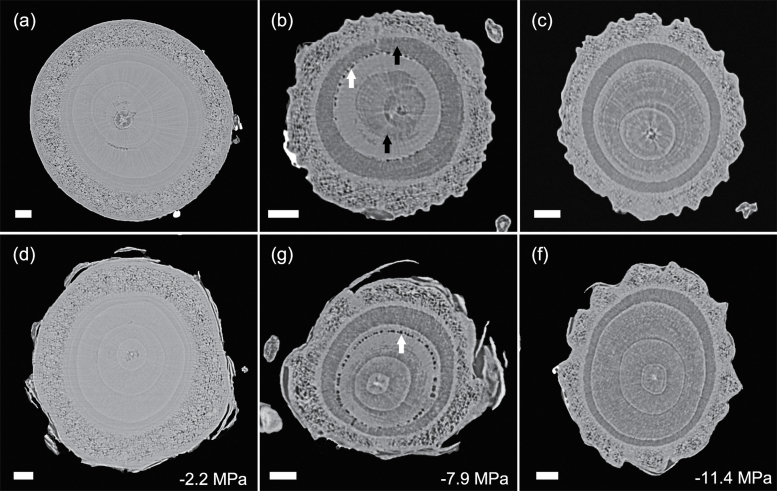
Fig. 8.
Transverse slices from microCT scans showing stems (A–C) and roots (D–F) of Cedrus deodara. Images are taken from a time series of scans during a dehydration treatment. Each vertical pair is a concurrent stem and root scan for one individual. Individuals differed between time points. The area of embolized tracheid (black arrows in B) increased with decreasing xylem water potential. Water-filled tracheids appear light grey. Empty resin canals (white arrows in B and G) can be seen in some slices. Water potentials (MPa) are shown at the time of each scan. Scale bars are equal to 1000 μm in all panels.

