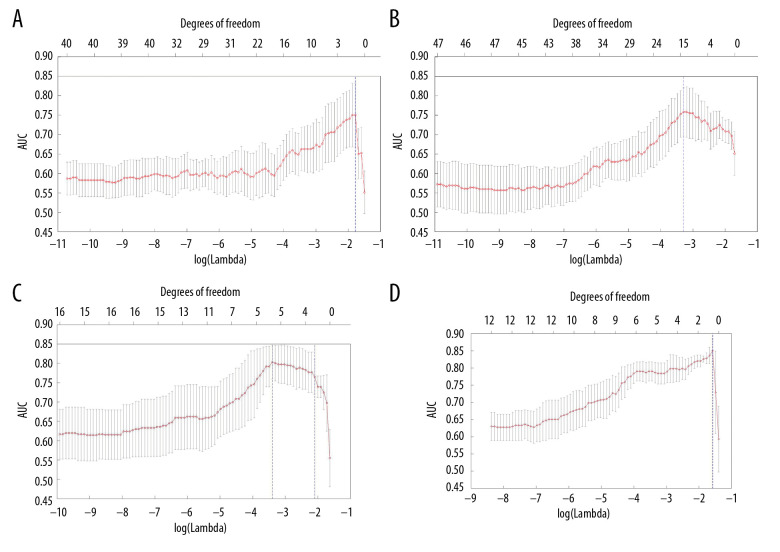
Figure 2.
Screening of features using the LASSO method: (A) CT features at baseline; (B) CT features at first evaluation; (C) CT features at baseline and first evaluation; (D) difference between CT features at baseline and at first evaluation. The x-axis shows the parameter λ and the corresponding number of features (degrees of freedom), and the y-axis shows the average AUC values. The dotted line corresponds to λ at the maximum AUC and the number of features.

