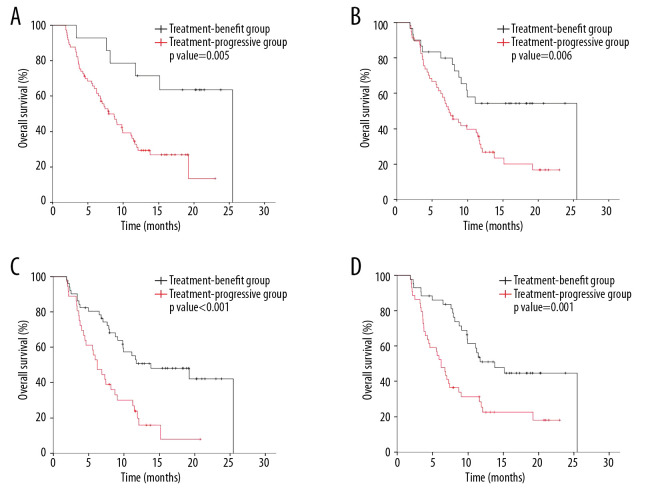
Figure 3.
Kaplan-Meier curves of patient overall survival based on the 4 models: (A) model 1, constructed from baseline CT features; (B) model 2, constructed from CT features at first evaluation; (C) model 3, constructed from CT features at baseline and at first evaluation; (D) model 4, constructed from the difference in CT features at baseline and at first evaluation.

