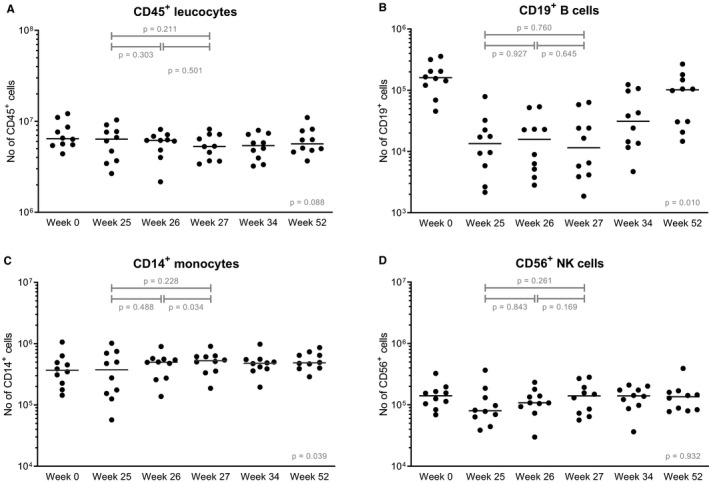
FIGURE 5.

Leukocytes before and after MSC infusion. Absolute numbers of (A) CD45+ leukocytes, (B) CD19+ B cells, (C) CD14+ monocytes, and (D) CD56+ NK cells are shown at baseline before transplantation, so before induction therapy, before the first MSC infusion (week 25) and before the second MSC infusion (week 26) and three time points after both infusions (week 27, week 34, and week 52). Median values are given for every time point (horizontal bars). The y‐axis is a logarithmic scale. P values are given for the differences between week 25‐26 (after the first infusion), week 26‐27 (after the second infusion), and for week 25‐27 (before MSC infusion and after both infusions). The P value given at week 52 is the difference before transplantation (week 0) and week 52. MSC, mesenchymal stromal cells; NK, natural killer
