
Fig. 1.
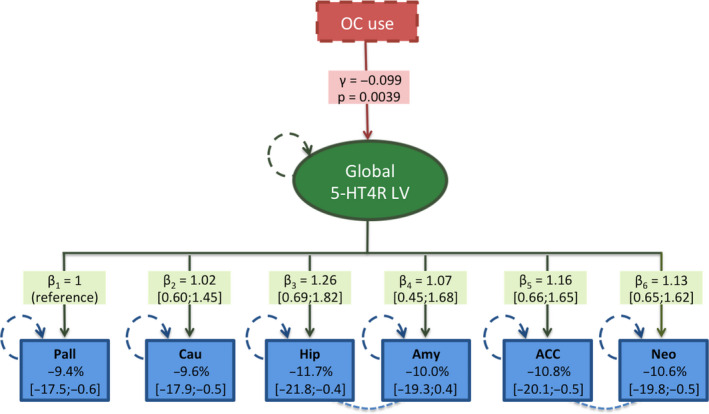
Illustration of the latent variable model showing the effect of OC use (represented by the γ‐value (on the log‐scale) and the corresponding P‐value) mediated by the global 5‐HT4R latent variable (LV) (green oval) on the six brain regions (blue boxes). The loading effects on each region are shown as β‐values (on the log‐scale) with 95% confidence intervals, and the corresponding OC effect on the regional 5‐HT4R binding potential (BPND) is shown as percent difference in each blue box. The hatched lines between hippocampus and amygdala and between ACC and neocortex illustrate partial correlation, which were included as covariance parameters. Circular green and blue hatched lines reflect variables estimated with error. Each regional BPND is independently corrected for age, scanner type, injected [11C]SB207145 mass per kg bodyweight, and familial risk for MDD (not illustrated). The percentage difference in BPND reported in the blue boxes was obtained after back transformation using (exp(γ × β)−1) × 100. Pall, pallidostriatum; Cau, caudate; ACC, anterior cingulate cortex; Neo, neocortex; Hip, hippocampus; Amy, amygdala. [Colour figure can be viewed at wileyonlinelibrary.com]