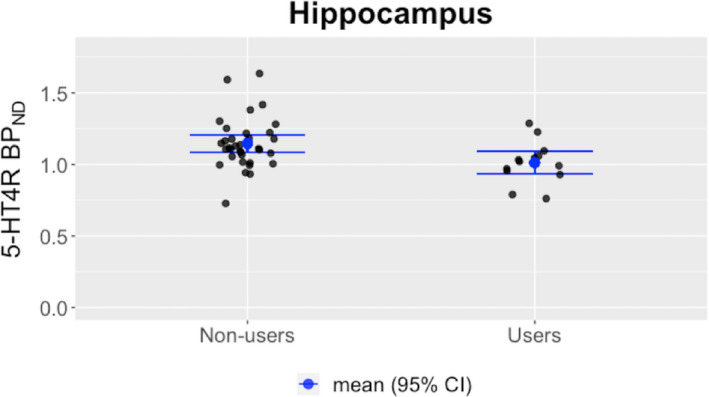
Fig. 3.

Mean value and bars indicating the 95% confidence interval are shown. Binding potentials (BPND's) are shown as unadjusted values, and for illustrative purposes, only data from High‐Resolution Research Tomograph (HRRT) PET scans are shown. [Colour figure can be viewed at wileyonlinelibrary.com]
