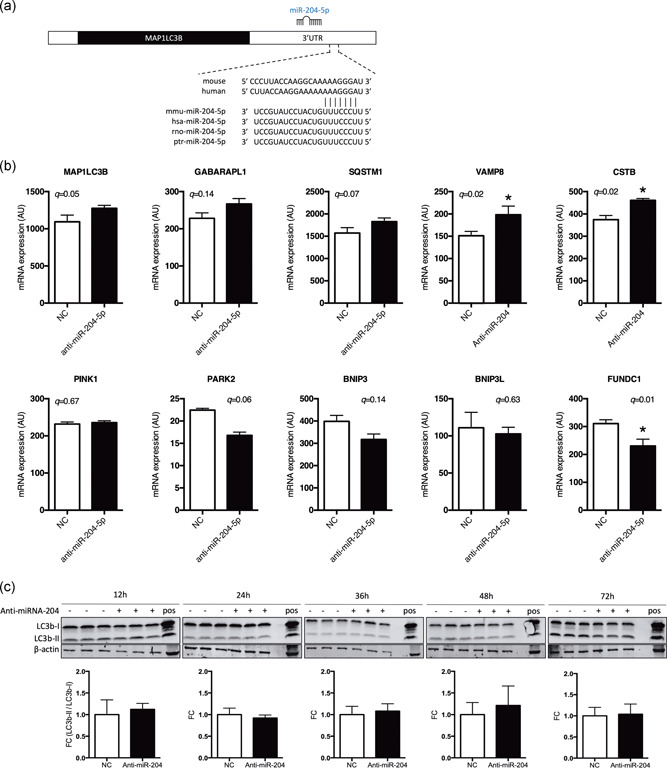
Figure 4.

miRNA‐204‐5p silencing does not increase LC3B‐I or LC3B‐II protein abundance. (a) Representation of the binding between the 3′‐UTR of LC3B (MAP1LC3B) mRNA and miRNA‐204‐5p across different species. (b) Gene expression analysis (microarray analysis) following anti‐miRNA‐204‐5p (24 hr) in differentiated C2C12 myotubes. *q < .05 (FDR adjusted q‐value intensity‐based moderated T‐statistic, n = 3). (c) LC3B‐I and LC3B‐II protein levels were quantified using western blot analysis 12, 24, 36, 48, and 72 hr posttransfection with either Negative Control A or anti‐miRNA‐204‐5p. In addition, transfected cells were compared to chloroquine treated C2C12 myotubes as a positive control (n = 3). 3′‐UTR, 3′‐untranslated region; FDR, false discovery rate; LC3B, light chain 3 protein b; miRNA, microRNA; mRNA, messenger RNA; NC, negative control
