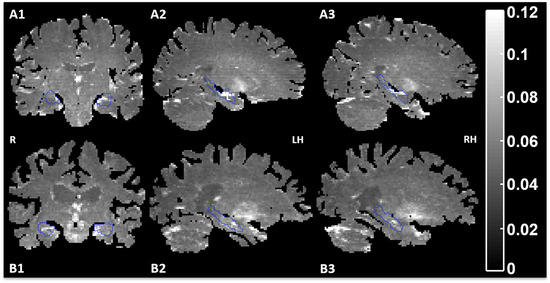
Fig 3.

Example of the fALFF maps in a healthy subject (male, 25 years, A1, A2, A3) and a left‐sided TLE patient (#3) (male, 45 years, B1, B2, B3). The hippocampi are delineated with a blue contour. Brighter spots indicate higher activity. R, right; LH, left hemisphere; RH, right hemisphere.
