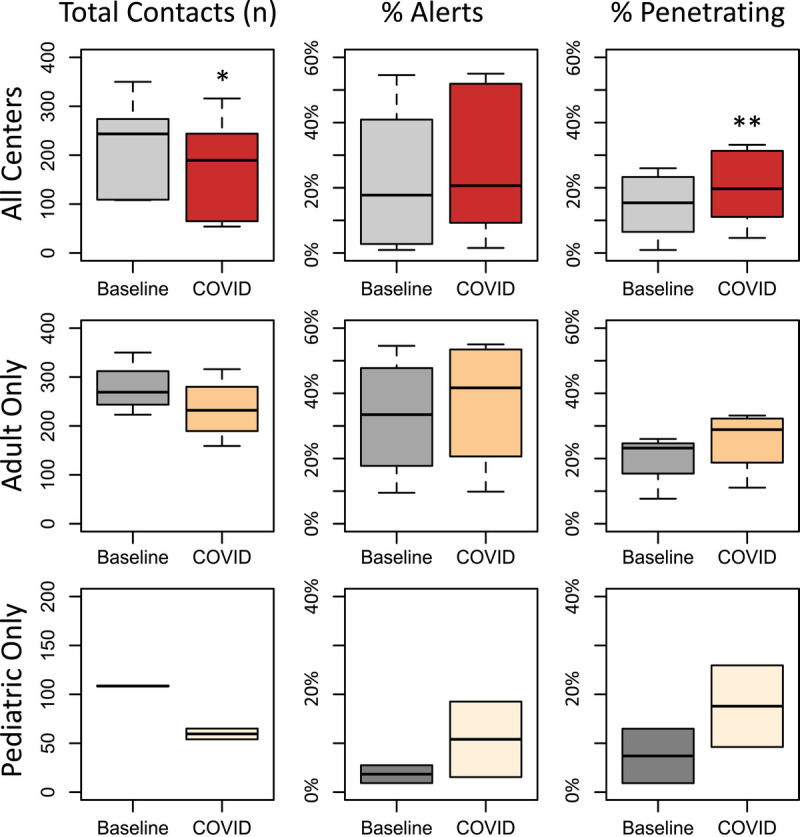
Figure 2.

Philadelphia Level I trauma activity by center March 9, 2019 to April 19, 2019 (Baseline) vs. March 9, 2020 to April 19, 2020 (COVID). The median is shown (line) with interquartile range (IQR, shaded box); whiskers represent 1.5 times the IQR. * p = 0.036, ** p = 0.031, all others p ≥ 0.05.
