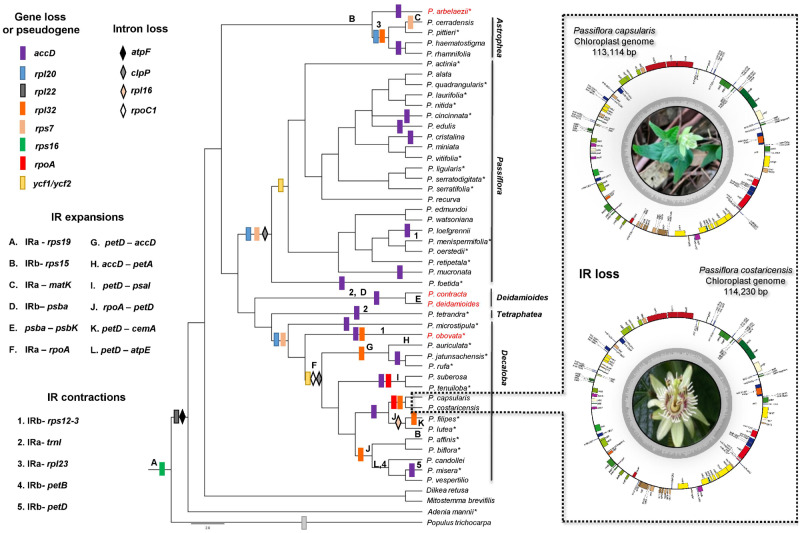
Fig. 1.
Gene losses, IR expansions/contractions mapped onto the cladogram of the Bayesian inference with plastid genes. *Species analyzed by Shrestha et al. (2019). The species in red belong to the subgenus Deidamioides. The chloroplast genomes of Passiflora capsularis and Passiflora costaricensis, the smallest in Passiflora due to the loss of an IR region, are shown on the right. Genes are represented as boxes inside or outside the large circle to indicate clockwise (inside) or counter clockwise (outside) transcription. The flower image of P. costaricensis was kindly provided by Maurizio Vecchia, 2005.

