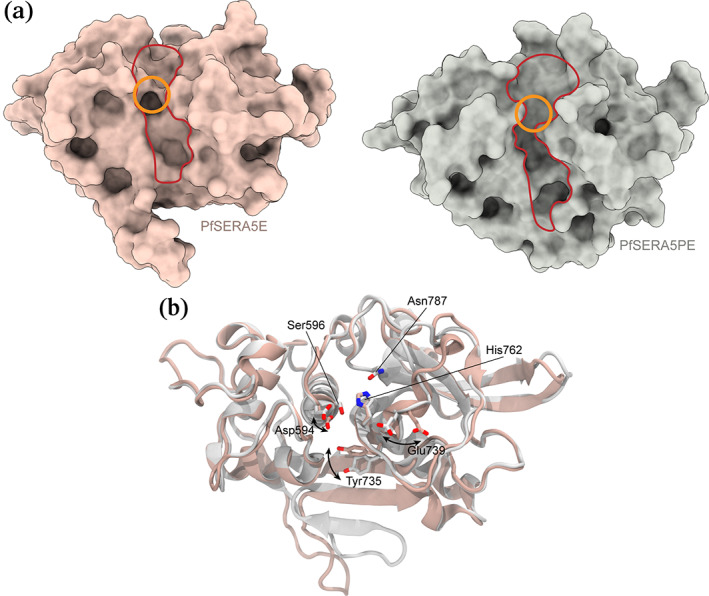
FIGURE 3.

Structures of the central domains of PfSERA5E and PfSERA5PE (the prodomain is removed for clarity) displayed in (a) space fill and (b) as ribbon representation overlaid. The non‐canonical "active‐site” groove is outlined in red and the “catalytic triad” in orange in the upper panel. Sidechains of the “catalytic triad” residues, and residues whose positions differ between PfSERA5E and PfSERA5PE responsible for the change in the molecular surface at the “active site” groove, are displayed in the lower panel in stick representation
