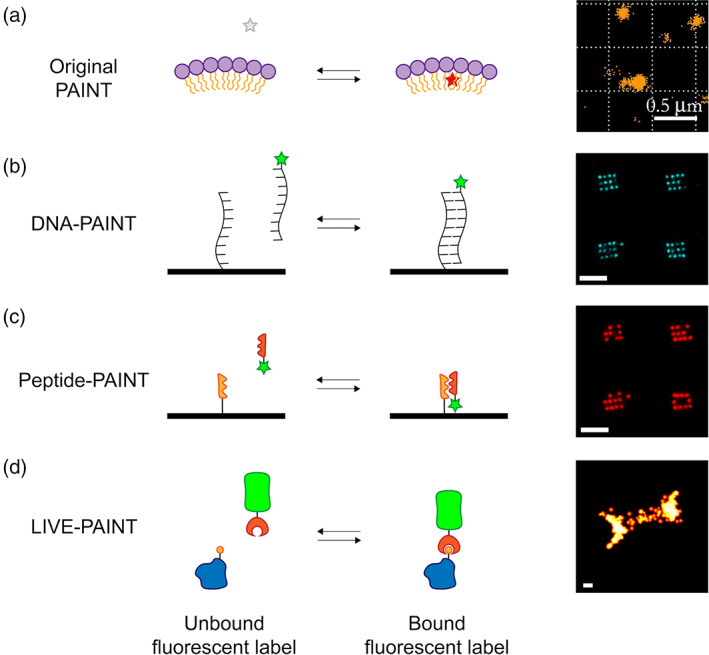
FIGURE 2.

Cartoon illustration of different PAINT methods. (a) “Original PAINT”. Left: a cartoon representation of a small molecule dye which is nonfluorescent in aqueous solution (grey star) but which fluoresces (red star) when it transiently interacts with the hydrophobic lipid membrane of the LUV (purple circles represent polar headgroups, yellow tails represent the aliphatic tails). Right: image of LUVs imaged using Nile red modified from Sharonov et al. 4 [copyright (2006) National Academy of Sciences]. (b) DNA‐PAINT. Left: cartoon representation in which the short ssDNA oligonucleotide to be imaged (for example part of a DNA origami surface array) is shown as a black strand. The complementary ssDNA oligonucleotide is shown as a black strand attached to a fluorescent dye (green star). Right: DNA origami nanostructures imaged using DNA‐PAINT, reproduced from Eklund et al. 1 (copyright Creative Commons Attribution 4.0 International license: https://creativecommons.org/licenses/by/4.0/). (c) Peptide‐PAINT. Left: cartoon representation in which the protein to be imaged is fused to a peptide (orange saw‐ tooth). The protein is visualized by the interaction of that peptide with a protein that binds it (red sawtooth) fused to a fluorescent dye (green star). Right: DNA origami nanostructures imaged using Peptide‐PAINT, reproduced from Eklund et al. 1 (copyright Creative Commons Attribution 4.0 International license: https://creativecommons.org/licenses/by/4.0/). (d) LIVE‐PAINT. Left: cartoon illustration in which the protein to be imaged (blue) is fused, at the gene level, to a peptide (orange circle). The protein is visualized by the interaction of that peptide with a protein that binds to it (red crescent), fused to a fluorescent protein (green barrel). Any fluorescent protein can be used. Oi et al. used the bright mNeonGreen. Right: image of the septum in live Saccharomyces cerevisiae, obtained by labeling Cdc12p and imaged using LIVE‐PAINT. Scalebars are 500 nm (a) and 100 nm (b–d). All images shown in panels (a–d) were acquired using TIRF
