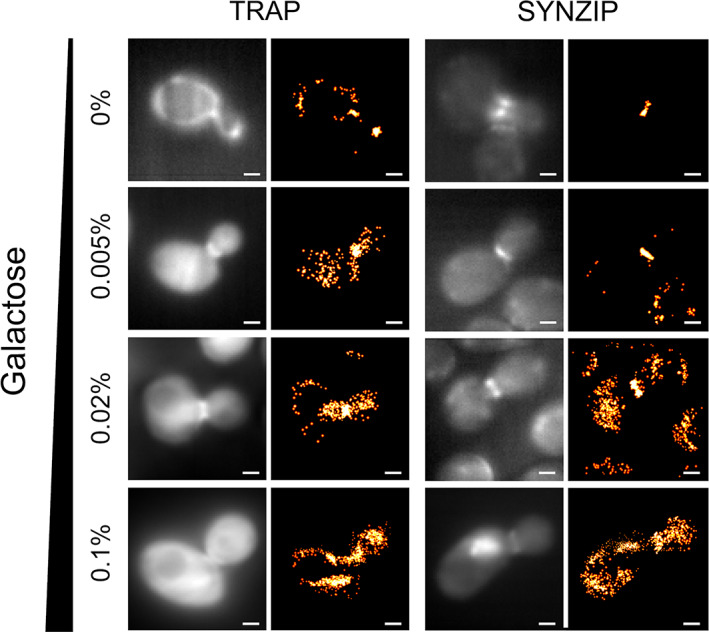
FIGURE 4.

Varying either the fluorescent protein expression level or the peptide–protein interaction pairs changes the number of localization events at the yeast bud neck during cell division. Pairs of diffraction‐limited and super‐resolution images are shown for Cdc12p‐MEEVF + TRAP4‐mNG (left) and Cdc12p‐SYNZIP18 + SYNZIP17‐mNG (right), at different concentrations of galactose (as indicated on the left). Expression level of the fluorescent construct was shown to be directly proportional to galactose concentration. Scale bars are 1 μm. Figure reproduced from Oi et al. 2 (copyright Creative Commons Attribution 4.0 International license: https://creativecommons.org/licenses/by/4.0/)
