
FIGURE 13.
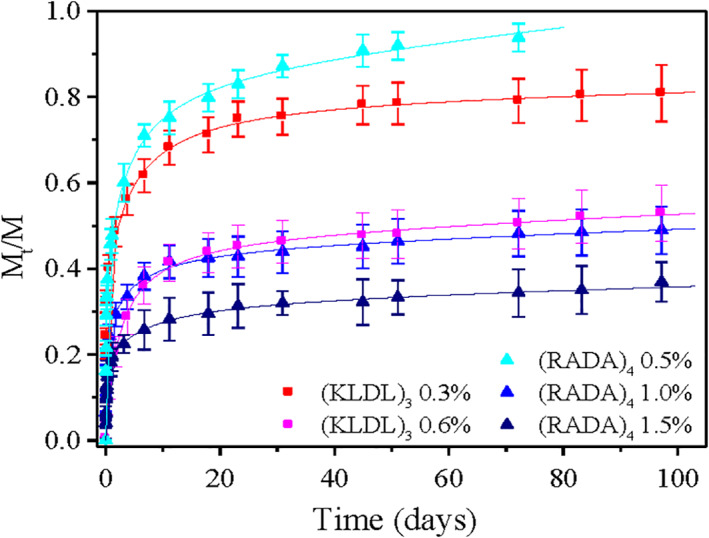
The release profiles during the entire 3‐month period for IgG through hydrogels of different peptides and different peptide nanofiber densities. Hydrogels consisted of the self‐assembling peptides (i) Ac‐N(RADA)4‐CONH2 with concentration 0.5% wt/vol (light blue, ▲), 1.0% wt/vol (blue, ▲), and 1.5% w/v (dark blue, ▲) and of (ii) ac‐(KLDL)3‐CONH2 with concentration 0.3% wt/vol (red, ■) and 0.6% wt/vol (magenta, ■). Release experiments were performed in PBS, pH 7.4 at room temperature. Data points represent the average of five samples. Image courtesy of Sotirios Koutsopolous 45