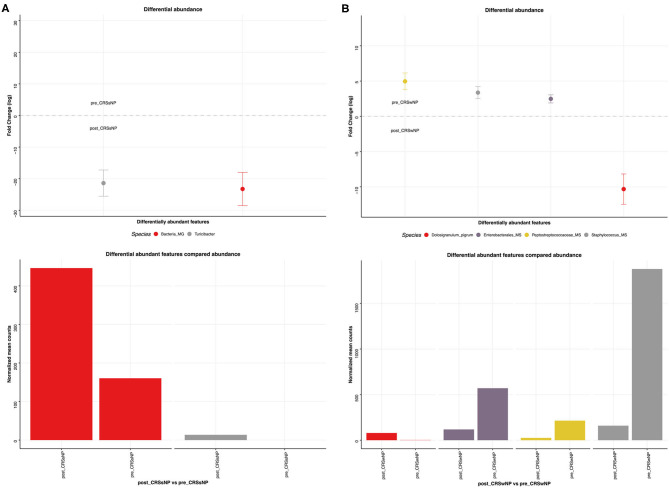
Figure 10.
Sinus microbial analysis of microbiome modifications before and after L. lactis W136 administration. (A) For CRSsNP (n = 7) and (B) For CRSwNP (n = 17) subgroups. Differentially abundant OTUs (FDR < 0.05) between before and after L. lactis W136 administration. The main axis represents the fold change (log2) in relative abundance of significantly different OTUs between the two groups and their normalized counts.

