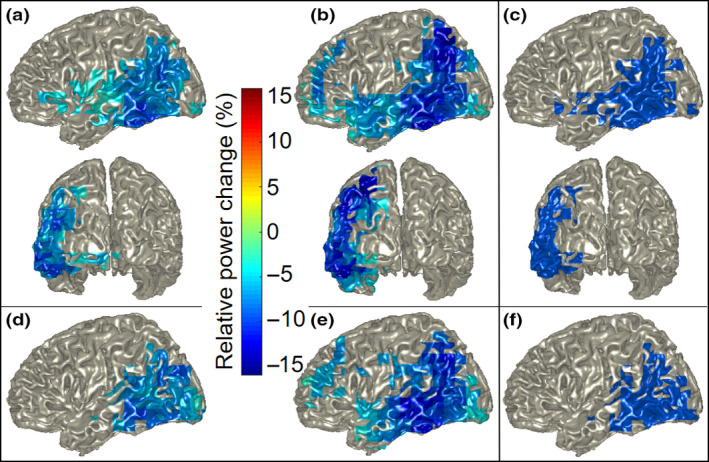
Figure 5.

Group‐level source localization power decreases for constrained relative to unconstrained sentences at 10 – 20 Hz for (a) full session 1 and (b) full session 2 in left and posterior views. Power decreases for (d) first half of session 1 and (e) first half of session 2 in the left hemisphere. Depicted areas are masked by statistically significant clusters. Overlap map of group‐level source localization showing areas of power changes common to both sessions for (c) the full sessions and (f) the first half of both sessions. Note: color scales do not apply to overlap maps [Colour figure can be viewed at wileyonlinelibrary.com]
