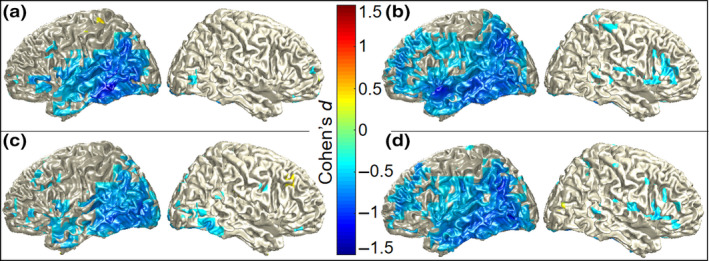
Figure 7.

Group‐level Cohen's d effect size measures of alpha–beta power differences per grid point for (a) full session 1, (b) full session 2, (c) half session 1, and (d) half session 2 in the left and right hemisphere. Color scales show Cohen's d‐values, thresholded at 0.5 [Colour figure can be viewed at wileyonlinelibrary.com]
