FIGURE 3.

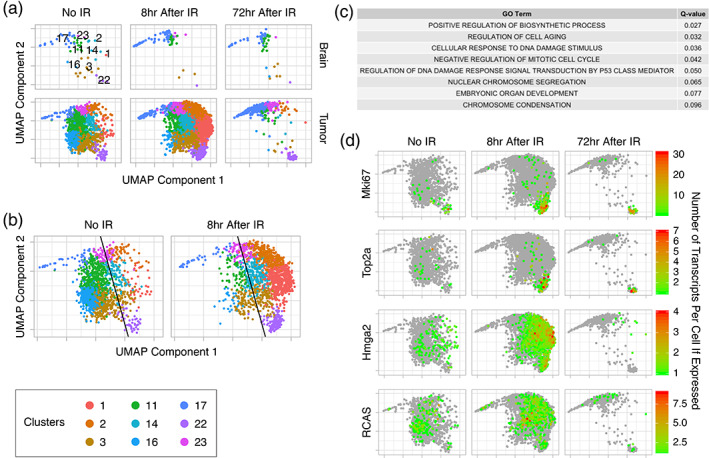
Tumor cell expression at 8 hr after IR shifts toward genes associated with the DNA damage signaling response and cell cycle arrest, followed by cell death leaving two radioresistant groups of cells (Clusters 17 and 23 and Cluster 22) at 72 hr after IR. (a) UMAP plots of the OPC/tumor supercluster by treatment group (No IR and 8 and 72 hr after IR) and sample type (brain and tumor) shows little change in normal brain samples, but a left‐to‐right shift between No IR and 8 hr after IR samples followed by a loss of most tumor cells at 72 hr after IR. Two groups of cells (Clusters 17 and 23 and Cluster 22) remain. Cluster numbers are shown in the upper left panel. (b) UMAP plots of samples without and 8 hr after IR showing the tumor supercluster with a best line drawn by support vector machine (SVM) to divide the cells into right (more similar to 8 hr after IR) and left (more similar to No IR) sides of the shift. (c) GO terms for enriched gene sets, as determined by Gene Set Enrichment Analysis (GSEA) comparing cells on the right of the left‐to‐right shift to those on the left, are associated with processes that are expected after IR. (d) Transcripts per cell of Mki67, Top2a, Hmga2, and RCAS in the OPC/tumor supercluster without (No IR) and 8 and 72 hr after IR are shown. The green to red spectrum represents cells with at least 1 transcript (see scales). Gray represents cells without any transcripts. Rapidly proliferating cells (Cluster 22 expressing Mki67 and Top2a) and slowly proliferating cells (Clusters 17 and 23) are enriched at 72 hr after IR, whereas Hmga2 expressing cells are enriched at 8 hr after IR and then depleted by 72 hr. RCAS viral transcript expression is similar in all treatment groups
