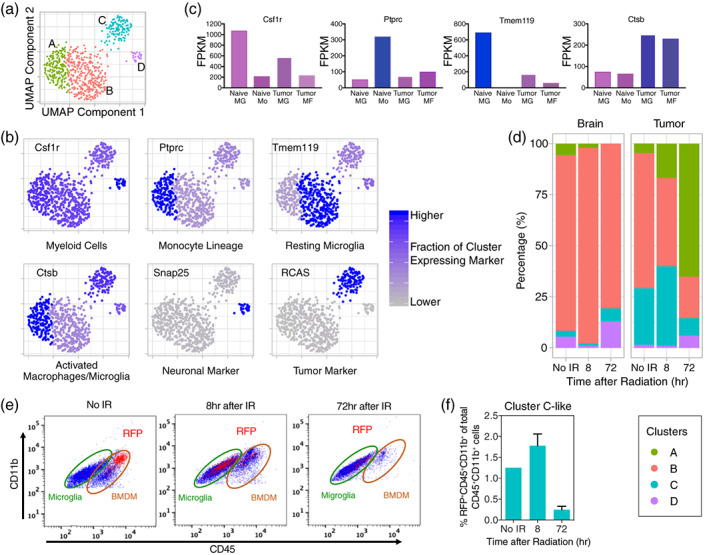
FIGURE 6.

Subclustering of the myeloid cell supercluster reveals four clusters of microglia and bone marrow‐derived macrophages (BMDM) that vary in percentage by sample type and treatment group, some of which have phagocytosed tumor cells. (a) UMAP re‐embedding and Louvain clustering of the myeloid cell supercluster outside the context of all other cells reveals four clusters: Cluster A is tumor‐associated, activated microglia and BMDM that have not phagocytosed tumor cells; Cluster B is non‐tumor‐associated, resting microglia; Cluster C is tumor‐associated microglia and BMDM that have phagocytosed tumor cells; and cluster D is non‐tumor‐associated microglia that have phagocytosed neural cells. (b) UMAP plots with each cluster colored by the fraction of cells in the cluster expressing common cell‐type‐specific markers or the RCAS viral transcript. (c) Fragments per kilobase of transcript per million mapped reads (FPKM) from bulk RNA‐seq of sorted naïve microglia (Naïve MG), blood monocytes (Naïve Mo), tumor‐associated microglia (Tumor MG), and tumor‐associated BMDM (Tumor MF) for common cell type‐specific markers. Combining data from (b) and (c) allows assignment of cell‐types to clusters in (a). (d) Percentages of clusters by treatment group (No IR and 8 and 72 hr after IR) and sample type (brain and tumor) are shown. In normal brain, the percentage of resting microglia (Cluster B), is mostly unchanged between treatment groups. In tumor without IR, the percentage of tumor‐associated, activated microglia and BMDM (Cluster C) is elevated as compared to normal brain. The percentage of tumor‐associated microglia and BMDM (Clusters A and C) increase at the expense of the resting microglia at 8 hr after IR. At 72 hr, the tumor‐associated microglia and BMDM that have not phagocytosed tumor cells (Cluster A) increase further, but those that have phagocytosed tumor cells (Cluster C) decrease consistent with loss of most of the tumor cells at this time. (e) Flow cytometry using cell surface markers (Figure S6 and Methods) was performed on brain with tumor to examine RFP‐positivity in microglia (CD11b+CD45LoLy6g−Ly6c−) and BMDM (CD11b+CD45Hi Ly6g−Ly6c−) without IR and at 8 and 72 hr after IR. RFP‐positivity indicates cells that had phagocytosed RFP‐expressing tumor cells. RFP+ cells are mostly BMDM without IR, but are mostly microglia at 8 hr after IR. (f) Percentages of myeloid cells (CD45+CD11b+) that are RFP+ without IR and at 8 and 72 hr after IR in brain with tumor. Error bars represent the standard deviation. RFP+ cells peak at 8 hr after IR and mostly disappear by 72 hr. These data are consistent with Cluster C in (a)
