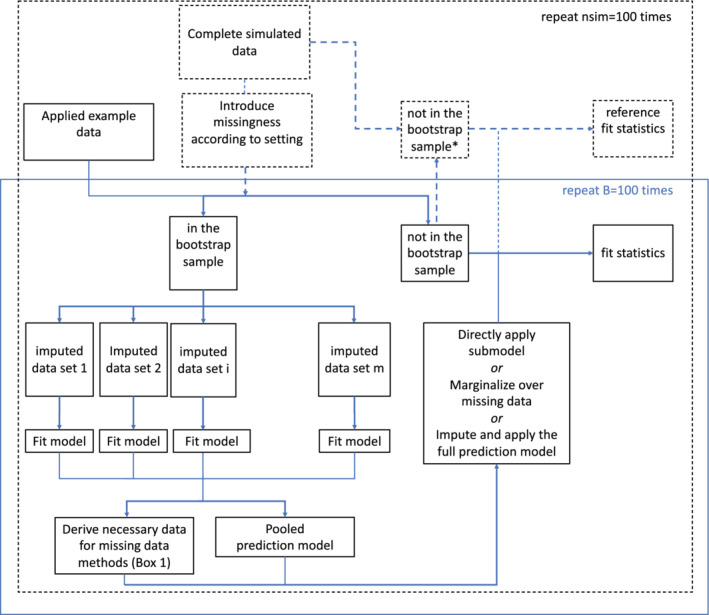
FIGURE 1.

The flow of both the simulation study and applied example are shown. Parts relating only to the simulation study are shown with dashed lines. The applied example included 100 bootstrap sample evaluations. * note that within each simulation iteration these are the same cases as the out‐of‐bag sample with missing data, but with fully observed information [Colour figure can be viewed at wileyonlinelibrary.com]
