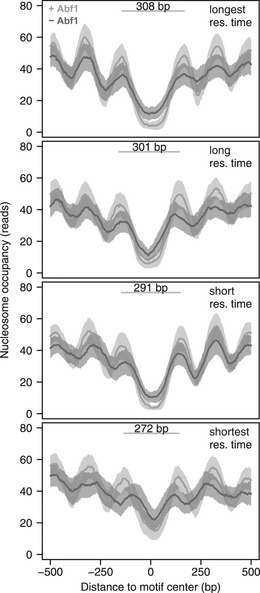
Figure 2. Nucleosomes architecture corresponds to mean residence times.

Average nucleosome occupancy of the mean residence time quartiles before (light grey) and after (dark grey) Abf1 depletion, centred on the Abf1 binding motif. Nucleosomes of all mean residence time quartiles reposition upon Abf1 depletion, which indicates that Abf1 contributes to the positioning of nucleosomes for all quartiles. The average distance between the midpoints of the −1 and +1 nucleosomes before depletion of Abf1 are indicated for each quartile. The confidence intervals are indicated by a transparent grey fill, calculated as the mean ± the standard error of the mean (SEM). Nucleosome binding data are from (Kubik et al, 2015).
