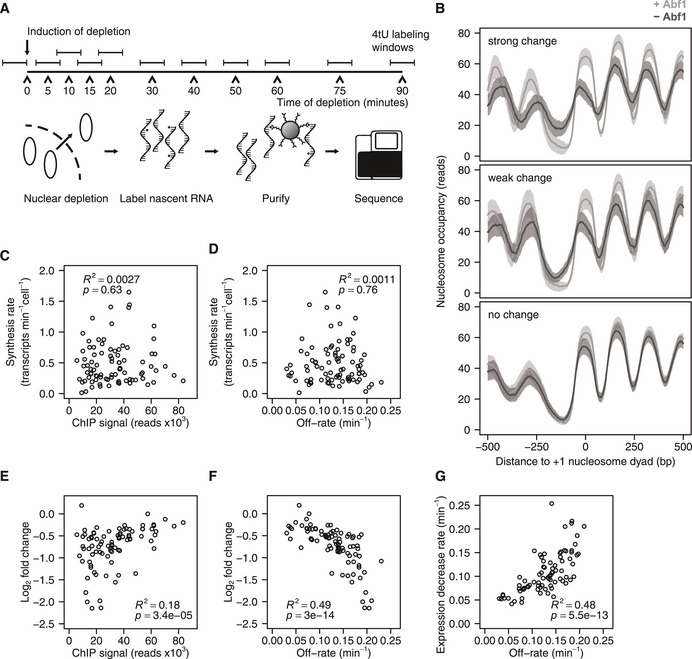
Figure 3. Dynamics of mRNA synthesis changes follow the dynamics of Abf1 dissociation.

-
ASchematic overview of the experiment set‐up for measuring promoter output dynamics by labelling nascent RNA. The protein of interest is depleted from the nucleus and nascent RNA is labelled for 6 min using 4‐thiouracil (4tU) at several time points during the depletion. Total RNA is extracted, nascent RNA is purified by biotinylating 4tU labelled RNA and the purified RNA is sequenced. Samples were taken such that the centre of the labelling period was the same as the time points that were used for DIVORSEQ.
-
BAverage nucleosome occupancy relative to +1 nucleosome dyad, of genes with Abf1 binding to the promoter that show strong changes (fold change > 2 at t = 20, top panel, n=44), weak changes (1.5 ≤ fold change ≤ 2 at t = 20, middle panel, n = 42) or no changes (fold change < 1.5 at t = 20, bottom panel, n = 112) in mRNA synthesis upon Abf1 depletion. Nucleosome occupancy is shown before (light grey) and after (dark grey) Abf1 depletion. The confidence intervals are indicated as in Fig 2 by a transparent grey fill, calculated as the mean ± SEM. Nucleosome binding data and +1 nucleosome positions are from (Kubik et al, 2015). Downregulated and Abf1 bound genes without an annotated +1 nucleosome were omitted from the plots.
-
C, DRelationship between steady‐state synthesis rates (Sun et al, 2012) and binding levels before depletion (C), or off‐rates (D). Genes are shown that are Abf1 bound and downregulated (fold change > 1.5 and P < 0.01 at 20 and 30 min of depletion, yielding 88 genes) and have available synthesis rates (n = 87).
-
E, FRelationship between log2 mRNA synthesis rate changes after 10 min of depletion and binding levels before depletion (E) or off‐rates (F). Genes are shown that are Abf1 bound and downregulated (fold change > 1.5 and P < 0.01 at 20 and 30 min of depletion, n = 88).
-
GRelationship between expression decrease rates of downregulated genes and off‐rates of the corresponding Abf1 binding site. The expression decrease rates were calculated by fitting the 4tU‐seq time data course using the same exponential decay model that was used for the off‐rates. The genes from (E‐F) are shown, except for the ones where the 4tU‐seq data could not be fitted with an exponential decay model (n = 82).
