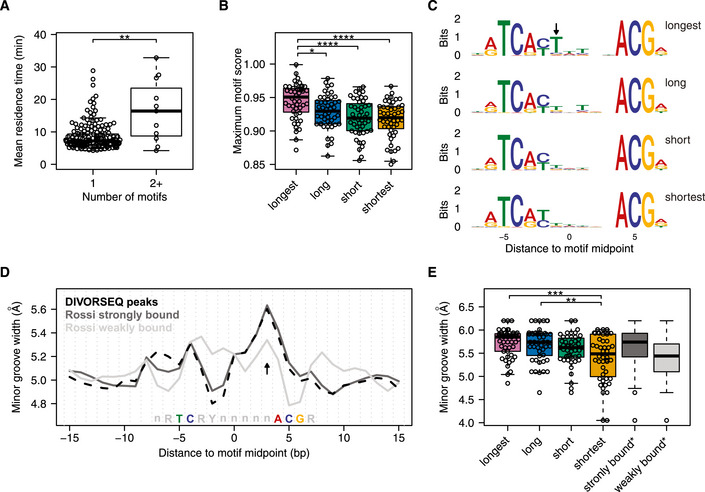
Figure 5. Factors that contribute to Abf1 binding stability.

- Difference in mean residence times between sites with one motif and sites with two or more motifs. The P‐value was calculated using a Wilcoxon rank‐sum test (**P = 0.0066), rather than a t‐test (P = 0.022) as used in Fig 4C, since the group with 1 binding motif is not normally distributed.
- Difference in maximum motif score between the different mean residence time quartiles. When a site has more than one motif, the highest score was used.
- Sequence logos showing the representative binding motif of each mean residence time quartile. Motifs from the longest mean residence time quartile are enriched (P = 0.0046) for having a thymine at position −1 bp (arrow).
- Predicted minor groove width centred at the Abf1 binding motif of all 191 Abf1 sites found here (black, dashed line) and Abf1 binding motifs defined as strongly bound (dark grey line) and weakly bound (light grey line) by (Rossi et al, 2018a).
- Difference in predicted minor groove width between the mean residence time quartiles at position +3 bp from the motif midpoint (D, arrow). In addition, the minor groove width at this position of the Abf1 motifs defined as strongly and weakly bound by (Rossi et al, 2018a) are shown (n = 400 for each group). Asterisks in (B) and (E) denote adjusted P‐values calculated using a one‐way ANOVA followed by Tukey's HSD test between the mean residence time quartiles (*P < 0.05, **P < 0.01, ***P < 0.001, ****P < 0.0001).
