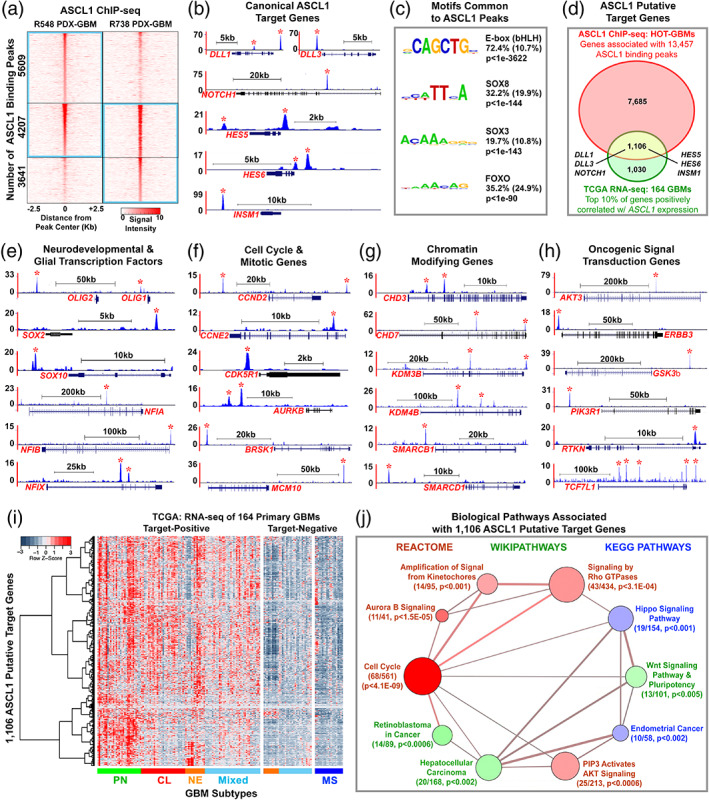
FIGURE 2.

ASCL1 binds to target genes in GBMs involved in glial development, cell cycle progression, and cancer. (a) Heatmap of ASCL1 ChIP‐seq signal intensity ±2.5 kb around 13,457 combined peaks identified in the genome of the PDX‐GBMs. Blue rectangles indicate statistically significant peaks called by Homer. See Supporting Information Table S1 for genomic coordinates of the ASCL1 binding sites. (b) ChIP‐seq tracks of genomic regions surrounding canonical ASCL1 target genes DLL1, DLL3, NOTCH1, HES5, HES6, and INSM1. Asterisks indicate ASCL1 binding peaks meeting statistical criteria. (c) De novo motif analysis shows enrichment of bHLH E‐box, SOX, and FOXO motifs directly beneath ASCL1 binding peaks. (d) Venn diagram of intersecting genes (8,791, red oval) associated with ASCL1 binding peaks in the PDX‐GBMs with the top 10% of genes (2,136, green oval) positively correlated (Spearmann corr < 0.4) with ASCL1 expression using RNA‐seq data of 164 TCGA GBM samples. The overlap of 1,106 genes (yellow area) defines ASCL1 target genes, which included all the canonical ASCL1 target genes. See Supporting Information Tables [Link], [Link]. (e–h) ChIP‐seq tracks of ASCL1 binding peaks at loci of neurodevelopmental and glial transcription factors (e), cell cycle and mitotic genes (f), chromatin modifying genes (g), and oncogenic signal transduction genes (h). (i) Heatmap and dendrogram illustrating relative expression of 1,106 ASCL1 putative target genes in GBM subtypes using RNA‐seq of 164 TCGA primary GBM samples (Brennan et al., 2013). Note that ASCL1 target‐positive GBMs include all subtypes except mesenchymal, while ASCL1 target‐negative GBMs include all mesenchymal and some neural and mixed GBM subtypes. (j) Gene set over‐representation analysis of 1,106 ASCL1 putative‐target genes using ConsensusPathDB (cpdb.molgen.mpg.de). Biologically relevant enriched pathways are illustrated. Size of circle indicates the number of genes per pathway, size of edge indicates degree of gene overlaps between the pathways, and color indicates database sources. The number of ASCL1 putative‐target genes over‐represented in each pathway, and respective p‐value are indicated. See Supporting Information Table S5 for complete gene set over‐representation analysis [Color figure can be viewed at wileyonlinelibrary.com]
