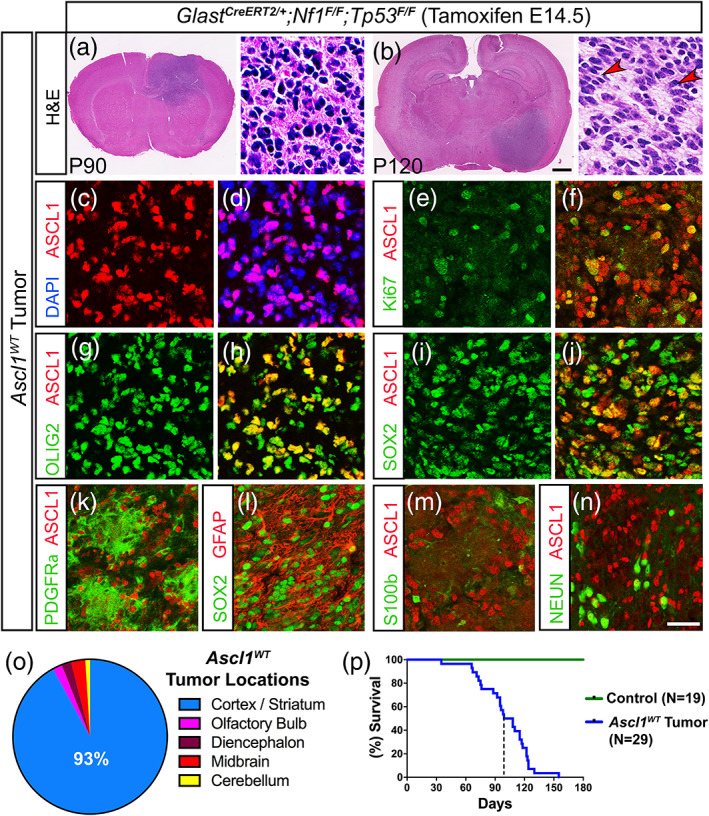
FIGURE 4.

Expression of ASCL1, OLIG2, and SOX2 are maintained in mice with terminal stage glioma tumors. (a and b) H&E staining of Ascl1 WT terminal stage tumors harvested at P90 and P120. Higher magnification insets show that tumors are high‐grade gliomas. Arrowheads indicate pseudopalisading cellular features consistent with GBM. (c–n) Immunofluorescence of Ascl1 WT tumor tissue. ASCL1 is present in the majority of DAPI+ tumor cells (c and d) and colocalizes with Ki67 (e and f), OLIG2 (g and h), and SOX2 (I and j). PDGFRα (k) and GFAP (l) are also coexpressed in ASCL1+ or SOX2+ tumor cells respectively, but not S100β (m) and NEUN (n). (o) Incidence of tumors observed in different brain regions is indicated. Over 90% of tumors are found in the cortex and striatum (N = 29). (p) Survival curve of Ascl1 WT tumor (N = 29) bearing mice and Cre‐negative control mice (N = 19). Dotted line indicates median survival of 102 days for Ascl1 WT tumor mice. Scale bar is 1 mm for whole brain section and 30 μm for insets in (a and b); and 25 μm for (c–n) [Color figure can be viewed at wileyonlinelibrary.com]
