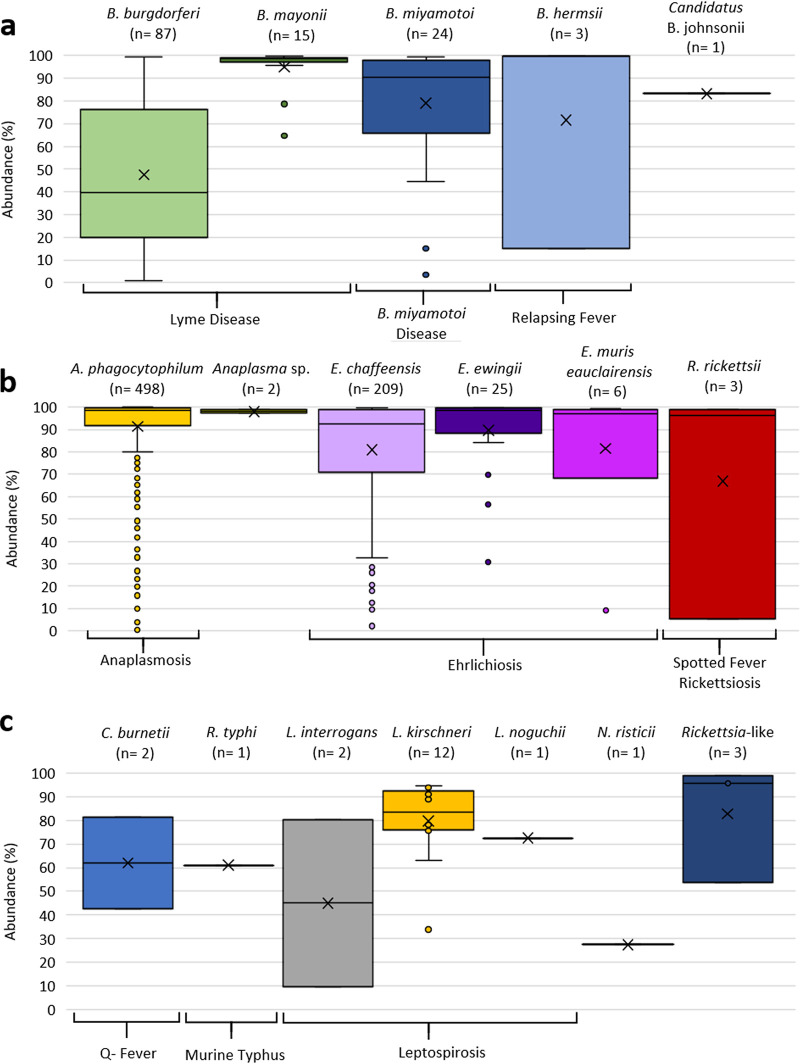
FIG 2.
Box-and-whisker plots showing the distribution of V1-V2 16S read abundances (percentages) for bacterial taxa identified in clinical specimens. The distribution of read abundances for a given taxon relative to all other bacterial taxa detected in the same specimen is shown. The number of clinical samples positive for each of the taxa is indicated at the top of each plot. If known, the disease associated with the bacterial taxon is indicated at the bottom of the y axis. The middle line of the box-and-whisker plot indicates the median, and “X” indicates the mean. The dots outside boxes indicate outliers. Read abundances are shown for Spirochaetales (a), Rickettsiales (b), and other validated taxa not known to be tick transmitted (c).

