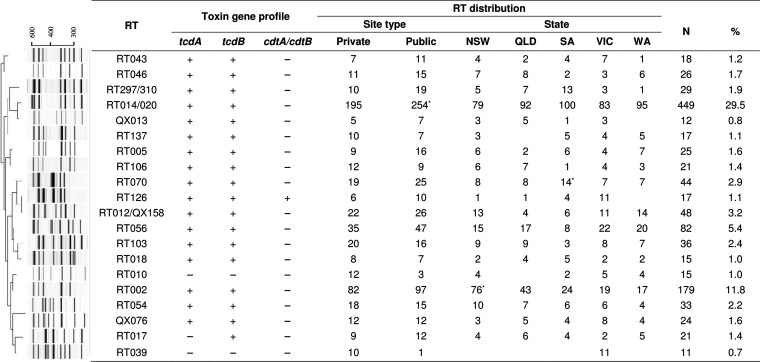
FIG 1.
Dendrogram summary, toxin profiles, and distributions of the 20 most prevalent C. difficile PCR RTs. PCR ribotyping pattern cluster analysis using both the Dice coefficient and the neighbor-joining method was used. Proportions were compared by χ2 test. *, P < 0.05. NSW, New South Wales; QLD, Queensland; SA, South Australia; VIC, Victoria; WA, Western Australia.

