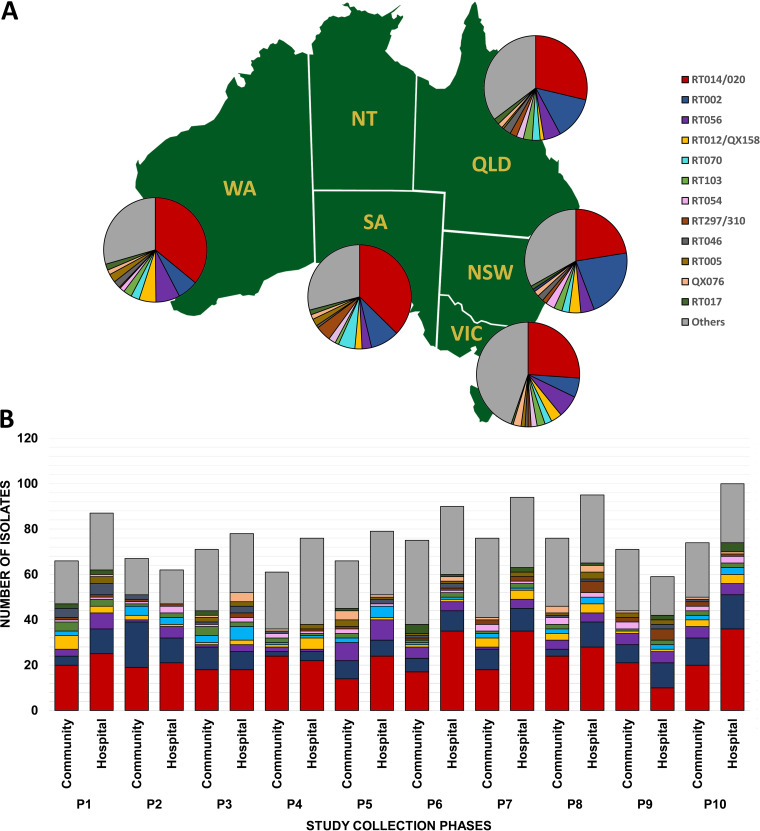
FIG 2.
Molecular epidemiology of CDI in Australia. Distribution of C. difficile RTs by Australian state (A) and by private or public collection site (B) over 10 collection phases, 2013 to 2018 (n = 1,523). NSW, New South Wales; QLD, Queensland; SA, South Australia; VIC, Victoria; WA, Western Australia. (The map was created with mapchart.net and is licensed under a Creative Commons Attribution-ShareAlike 4.0 International License [https://creativecommons.org/licenses/by-sa/4.0/].)

